

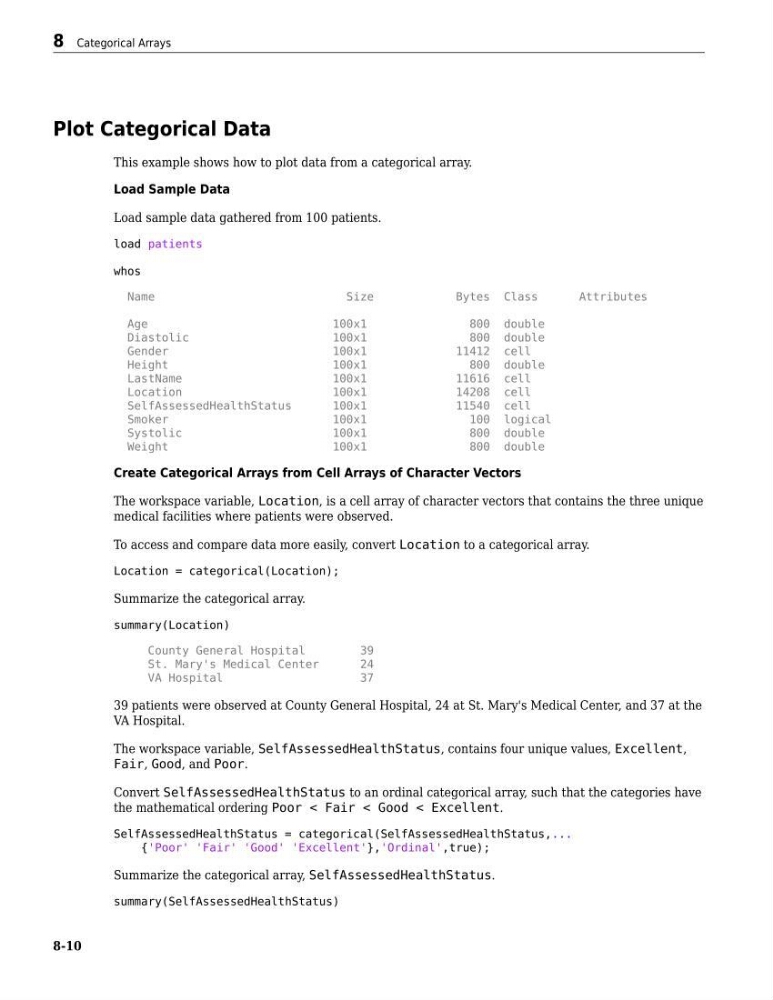
Plot Categorical Data
This example shows how to plot data from a categorical array.
Load Sample Data
Load sample data gathered from 100 patients.
load patients
whos
Name
Size
Bytes Class
Attributes
Age
100x1
800 double
Diastolic
100x1
800 double
Gender
100x1
11412 cell
Height
100x1
800 double
LastName
100x1
11616 cell
Location
100x1
14208 cell
SelfAssessedHealthStatus
100x1
11540 cell
Smoker
100x1
100 logical
Systolic
100x1
800 double
Weight
100x1
800 double
Create Categorical Arrays from Cell Arrays of Character Vectors
The workspace variable, Location, is a cell array of character vectors that contains the three unique
medical facilities where patients were observed.
To access and compare data more easily, convert Location to a categorical array.
Location = categorical(Location);
Summarize the categorical array.
summary(Location)
County General Hospital
39
St. Mary's Medical Center
24
VA Hospital
37
39 patients were observed at County General Hospital, 24 at St. Mary's Medical Center, and 37 at the
VA Hospital.
The workspace variable, SelfAssessedHealthStatus, contains four unique values, Excellent,
Fair, Good, and Poor.
Convert SelfAssessedHealthStatus to an ordinal categorical array, such that the categories have
the mathematical ordering Poor < Fair < Good < Excellent.
SelfAssessedHealthStatus = categorical(SelfAssessedHealthStatus,...
{'Poor' 'Fair' 'Good' 'Excellent'},'Ordinal',true);
Summarize the categorical array, SelfAssessedHealthStatus.
summary(SelfAssessedHealthStatus)
8 Categorical Arrays
8-10
This example shows how to plot data from a categorical array.
Load Sample Data
Load sample data gathered from 100 patients.
load patients
whos
Name
Size
Bytes Class
Attributes
Age
100x1
800 double
Diastolic
100x1
800 double
Gender
100x1
11412 cell
Height
100x1
800 double
LastName
100x1
11616 cell
Location
100x1
14208 cell
SelfAssessedHealthStatus
100x1
11540 cell
Smoker
100x1
100 logical
Systolic
100x1
800 double
Weight
100x1
800 double
Create Categorical Arrays from Cell Arrays of Character Vectors
The workspace variable, Location, is a cell array of character vectors that contains the three unique
medical facilities where patients were observed.
To access and compare data more easily, convert Location to a categorical array.
Location = categorical(Location);
Summarize the categorical array.
summary(Location)
County General Hospital
39
St. Mary's Medical Center
24
VA Hospital
37
39 patients were observed at County General Hospital, 24 at St. Mary's Medical Center, and 37 at the
VA Hospital.
The workspace variable, SelfAssessedHealthStatus, contains four unique values, Excellent,
Fair, Good, and Poor.
Convert SelfAssessedHealthStatus to an ordinal categorical array, such that the categories have
the mathematical ordering Poor < Fair < Good < Excellent.
SelfAssessedHealthStatus = categorical(SelfAssessedHealthStatus,...
{'Poor' 'Fair' 'Good' 'Excellent'},'Ordinal',true);
Summarize the categorical array, SelfAssessedHealthStatus.
summary(SelfAssessedHealthStatus)
8 Categorical Arrays
8-10