

format compact
summary(T)
Variables:
Age: 100x1 double
Values:
Min
25
Median
39
Max
50
Gender: 100x1 categorical
Values:
Female
53
Male
47
Height: 100x1 double
Values:
Min
60
Median
67
Max
72
Weight: 100x1 double
Values:
Min
111
Median
142.5
Max
202
SelfAssessedHealthStatus: 100x1 ordinal categorical
Values:
Poor
11
Fair
15
Good
40
Excellent
34
Location: 100x1 categorical
Values:
County General Hospital
39
St. Mary s Medical Center
24
VA Hospital
37
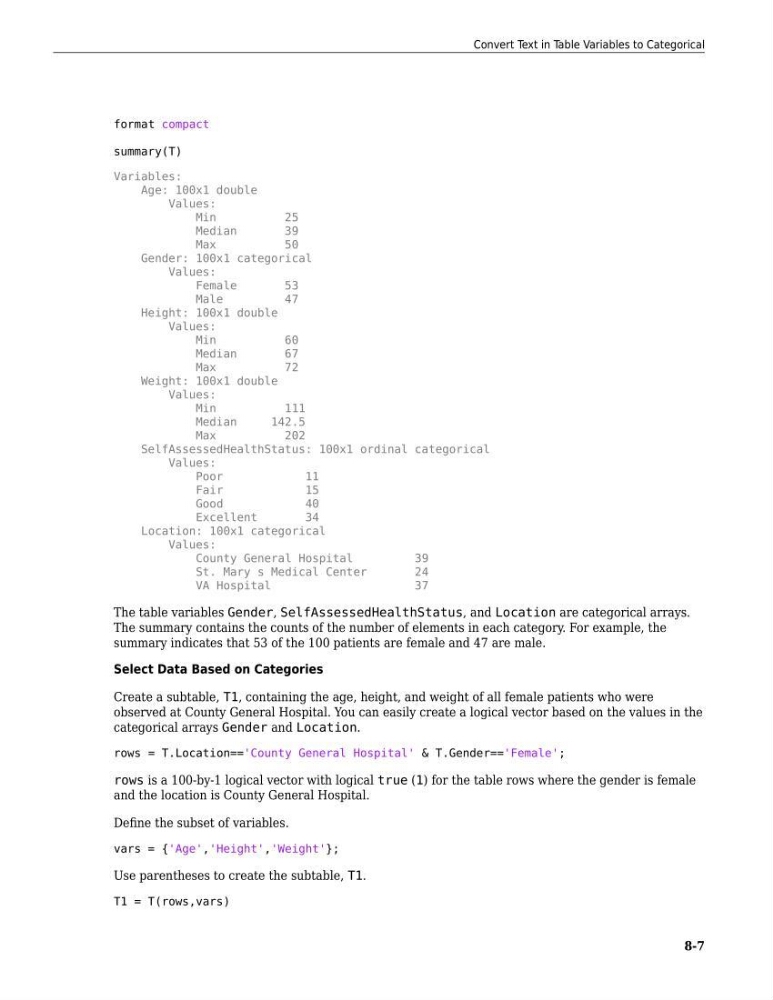
The table variables Gender, SelfAssessedHealthStatus, and Location are categorical arrays.
The summary contains the counts of the number of elements in each category. For example, the
summary indicates that 53 of the 100 patients are female and 47 are male.
Select Data Based on Categories
Create a subtable, T1, containing the age, height, and weight of all female patients who were
observed at County General Hospital. You can easily create a logical vector based on the values in the
categorical arrays Gender and Location.
rows = T.Location=='County General Hospital' & T.Gender=='Female';
rows is a 100-by-1 logical vector with logical true (1) for the table rows where the gender is female
and the location is County General Hospital.
Define the subset of variables.
vars = {'Age','Height','Weight'};
Use parentheses to create the subtable, T1.
T1 = T(rows,vars)
Convert Text in Table Variables to Categorical
8-7
summary(T)
Variables:
Age: 100x1 double
Values:
Min
25
Median
39
Max
50
Gender: 100x1 categorical
Values:
Female
53
Male
47
Height: 100x1 double
Values:
Min
60
Median
67
Max
72
Weight: 100x1 double
Values:
Min
111
Median
142.5
Max
202
SelfAssessedHealthStatus: 100x1 ordinal categorical
Values:
Poor
11
Fair
15
Good
40
Excellent
34
Location: 100x1 categorical
Values:
County General Hospital
39
St. Mary s Medical Center
24
VA Hospital
37
The table variables Gender, SelfAssessedHealthStatus, and Location are categorical arrays.
The summary contains the counts of the number of elements in each category. For example, the
summary indicates that 53 of the 100 patients are female and 47 are male.
Select Data Based on Categories
Create a subtable, T1, containing the age, height, and weight of all female patients who were
observed at County General Hospital. You can easily create a logical vector based on the values in the
categorical arrays Gender and Location.
rows = T.Location=='County General Hospital' & T.Gender=='Female';
rows is a 100-by-1 logical vector with logical true (1) for the table rows where the gender is female
and the location is County General Hospital.
Define the subset of variables.
vars = {'Age','Height','Weight'};
Use parentheses to create the subtable, T1.
T1 = T(rows,vars)
Convert Text in Table Variables to Categorical
8-7