

The normal distribution 563
Probability
density
Standard deviations
0 z 2
z 1
z-value
Figure 58.2
Problem 1. The mean height of 500 people is
170 cm and the standard deviation is 9 cm.
Assuming the heights are normally distributed,
determine the number of people likely to have
heights between 150 cm and 195 cm.
The mean value, x , is 170 cm and corresponds to a
normal standard variate value, z, of zero on the standardized normal curve. A height of 150 cm has a z-value
given by z =
x − x
σ
standard deviations, i.e.
150 −170
9
or −2.22 standard deviations. Using a table of partial areas beneath the standardized normal curve (see
Table 58.1), a z-value of −2.22 corresponds to an area
of 0.4868 between the mean value and the ordinate
z =−2.22. The negative z-value shows that it lies to
the left of the z = 0 ordinate.
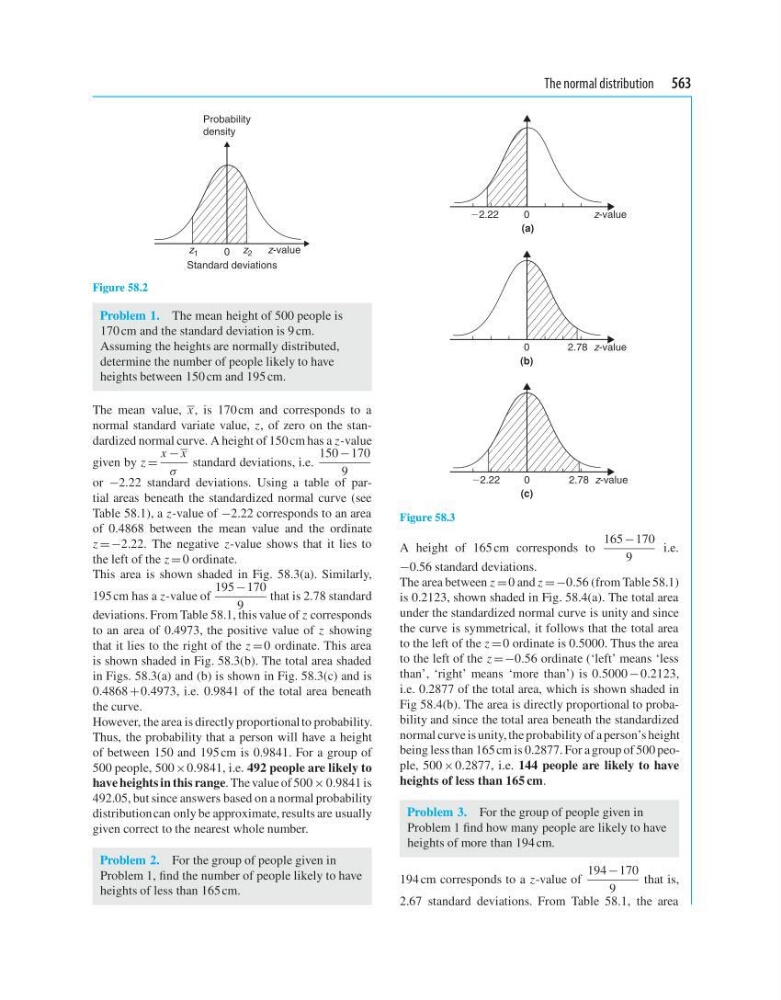
This area is shown shaded in Fig. 58.3(a). Similarly,
195 cm has a z-value of
195 −170
9
that is 2.78 standard
deviations. From Table 58.1, this value of z corresponds
to an area of 0.4973, the positive value of z showing
that it lies to the right of the z = 0 ordinate. This area
is shown shaded in Fig. 58.3(b). The total area shaded
in Figs. 58.3(a) and (b) is shown in Fig. 58.3(c) and is
0.4868 +0.4973, i.e. 0.9841 of the total area beneath
the curve.
However, the area is directly proportional to probability.
Thus, the probability that a person will have a height
of between 150 and 195 cm is 0.9841. For a group of
500 people, 500 ×0.9841, i.e. 492 people are likely to
have heights in this range. The value of 500 × 0.9841 is
492.05, but since answers based on a normal probability
distribution can only be approximate, results are usually
given correct to the nearest whole number.
Problem 2. For the group of people given in
Problem 1, find the number of people likely to have
heights of less than 165 cm.
0
z-value
0
z-value
z-value
22.22
22.22
(a)
2.78
(b)
0
2.78
(c)
Figure 58.3
A height of 165 cm corresponds to
165 −170
9
i.e.
−0.56 standard deviations.
The area between z = 0 and z =−0.56 (from Table 58.1)
is 0.2123, shown shaded in Fig. 58.4(a). The total area
under the standardized normal curve is unity and since
the curve is symmetrical, it follows that the total area
to the left of the z = 0 ordinate is 0.5000. Thus the area
to the left of the z =−0.56 ordinate (‘left’ means ‘less
than’, ‘right’ means ‘more than’) is 0.5000 − 0.2123,
i.e. 0.2877 of the total area, which is shown shaded in
Fig 58.4(b). The area is directly proportional to probability and since the total area beneath the standardized
normal curve is unity, the probability of a person’s height
being less than 165 cm is 0.2877. For a group of 500 people, 500 × 0.2877, i.e. 144 people are likely to have
heights of less than 165 cm.
Problem 3. For the group of people given in
Problem 1 find how many people are likely to have
heights of more than 194 cm.
194 cm corresponds to a z-value of
194 −170
9
that is,
2.67 standard deviations. From Table 58.1, the area
Probability
density
Standard deviations
0 z 2
z 1
z-value
Figure 58.2
Problem 1. The mean height of 500 people is
170 cm and the standard deviation is 9 cm.
Assuming the heights are normally distributed,
determine the number of people likely to have
heights between 150 cm and 195 cm.
The mean value, x , is 170 cm and corresponds to a
normal standard variate value, z, of zero on the standardized normal curve. A height of 150 cm has a z-value
given by z =
x − x
σ
standard deviations, i.e.
150 −170
9
or −2.22 standard deviations. Using a table of partial areas beneath the standardized normal curve (see
Table 58.1), a z-value of −2.22 corresponds to an area
of 0.4868 between the mean value and the ordinate
z =−2.22. The negative z-value shows that it lies to
the left of the z = 0 ordinate.
This area is shown shaded in Fig. 58.3(a). Similarly,
195 cm has a z-value of
195 −170
9
that is 2.78 standard
deviations. From Table 58.1, this value of z corresponds
to an area of 0.4973, the positive value of z showing
that it lies to the right of the z = 0 ordinate. This area
is shown shaded in Fig. 58.3(b). The total area shaded
in Figs. 58.3(a) and (b) is shown in Fig. 58.3(c) and is
0.4868 +0.4973, i.e. 0.9841 of the total area beneath
the curve.
However, the area is directly proportional to probability.
Thus, the probability that a person will have a height
of between 150 and 195 cm is 0.9841. For a group of
500 people, 500 ×0.9841, i.e. 492 people are likely to
have heights in this range. The value of 500 × 0.9841 is
492.05, but since answers based on a normal probability
distribution can only be approximate, results are usually
given correct to the nearest whole number.
Problem 2. For the group of people given in
Problem 1, find the number of people likely to have
heights of less than 165 cm.
0
z-value
0
z-value
z-value
22.22
22.22
(a)
2.78
(b)
0
2.78
(c)
Figure 58.3
A height of 165 cm corresponds to
165 −170
9
i.e.
−0.56 standard deviations.
The area between z = 0 and z =−0.56 (from Table 58.1)
is 0.2123, shown shaded in Fig. 58.4(a). The total area
under the standardized normal curve is unity and since
the curve is symmetrical, it follows that the total area
to the left of the z = 0 ordinate is 0.5000. Thus the area
to the left of the z =−0.56 ordinate (‘left’ means ‘less
than’, ‘right’ means ‘more than’) is 0.5000 − 0.2123,
i.e. 0.2877 of the total area, which is shown shaded in
Fig 58.4(b). The area is directly proportional to probability and since the total area beneath the standardized
normal curve is unity, the probability of a person’s height
being less than 165 cm is 0.2877. For a group of 500 people, 500 × 0.2877, i.e. 144 people are likely to have
heights of less than 165 cm.
Problem 3. For the group of people given in
Problem 1 find how many people are likely to have
heights of more than 194 cm.
194 cm corresponds to a z-value of
194 −170
9
that is,
2.67 standard deviations. From Table 58.1, the area