

The binomial and Poisson distributions 561
0.28
0.24
Probability of having an accident
0.20
0.16
0.12
0.08
0.04
0 0
1
2
3
4
5
Number of people
6
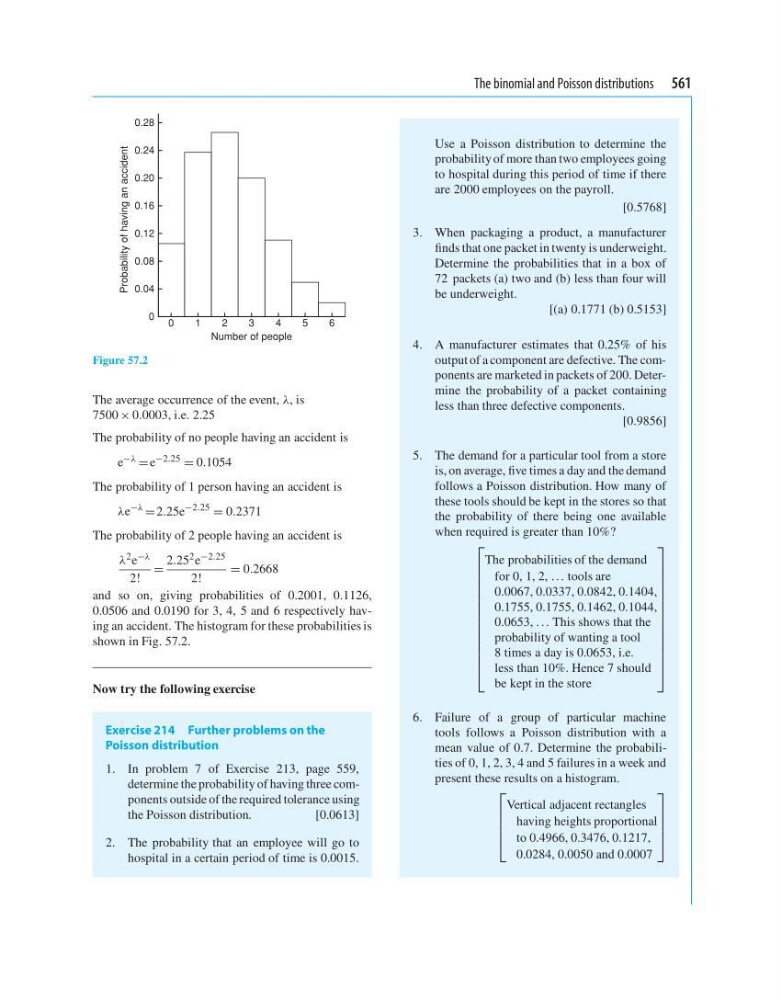
Figure 57.2
The average occurrence of the event, λ, is
7500 × 0.0003, i.e. 2.25
The probability of no people having an accident is
e −λ = e −2.25 = 0.1054
The probability of 1 person having an accident is
λe
−λ
= 2.25e
−2.25
= 0.2371
The probability of 2 people having an accident is
λ 2 e −λ
2!
=
2.25 2 e −2.25
2!
= 0.2668
and so on, giving probabilities of 0.2001, 0.1126,
0.0506 and 0.0190 for 3, 4, 5 and 6 respectively having an accident. The histogram for these probabilities is
shown in Fig. 57.2.
Now try the following exercise
Exercise 214 Further problems on the
Poisson distribution
1. In problem 7 of Exercise 213, page 559,
determine the probability of having three components outside of the required tolerance using
the Poisson distribution.
[0.0613]
2. The probability that an employee will go to
hospital in a certain period of time is 0.0015.
Use a Poisson distribution to determine the
probability of more than two employees going
to hospital during this period of time if there
are 2000 employees on the payroll.
[0.5768]
3. When packaging a product, a manufacturer
finds that one packet in twenty is underweight.
Determine the probabilities that in a box of
72 packets (a) two and (b) less than four will
be underweight.
[(a) 0.1771 (b) 0.5153]
4. A manufacturer estimates that 0.25% of his
output of a component are defective. The components are marketed in packets of 200. Determine the probability of a packet containing
less than three defective components.
[0.9856]
5. The demand for a particular tool from a store
is, on average, five times a day and the demand
follows a Poisson distribution. How many of
these tools should be kept in the stores so that
the probability of there being one available
when required is greater than 10%?
⎡
⎢
⎢
⎢
⎢
⎢
⎢
⎢
⎢
⎢
⎢
⎢
⎢
⎢
⎣
The probabilities of the demand
for 0, 1, 2, ... tools are
0.0067, 0.0337, 0.0842, 0.1404,
0.1755, 0.1755, 0.1462, 0.1044,
0.0653, ... This shows that the
probability of wanting a tool
8 times a day is 0.0653, i.e.
less than 10%. Hence 7 should
be kept in the store
⎤
⎥
⎥
⎥
⎥
⎥
⎥
⎥
⎥
⎥
⎥
⎥
⎥
⎥
⎦
6. Failure of a group of particular machine
tools follows a Poisson distribution with a
mean value of 0.7. Determine the probabilities of 0, 1, 2, 3, 4 and 5 failures in a week and
present these results on a histogram.
⎡
⎢
⎢
⎢
⎣
Vertical adjacent rectangles
having heights proportional
to 0.4966, 0.3476, 0.1217,
0.0284, 0.0050 and 0.0007
⎤
⎥
⎥
⎥
⎦
0.28
0.24
Probability of having an accident
0.20
0.16
0.12
0.08
0.04
0 0
1
2
3
4
5
Number of people
6
Figure 57.2
The average occurrence of the event, λ, is
7500 × 0.0003, i.e. 2.25
The probability of no people having an accident is
e −λ = e −2.25 = 0.1054
The probability of 1 person having an accident is
λe
−λ
= 2.25e
−2.25
= 0.2371
The probability of 2 people having an accident is
λ 2 e −λ
2!
=
2.25 2 e −2.25
2!
= 0.2668
and so on, giving probabilities of 0.2001, 0.1126,
0.0506 and 0.0190 for 3, 4, 5 and 6 respectively having an accident. The histogram for these probabilities is
shown in Fig. 57.2.
Now try the following exercise
Exercise 214 Further problems on the
Poisson distribution
1. In problem 7 of Exercise 213, page 559,
determine the probability of having three components outside of the required tolerance using
the Poisson distribution.
[0.0613]
2. The probability that an employee will go to
hospital in a certain period of time is 0.0015.
Use a Poisson distribution to determine the
probability of more than two employees going
to hospital during this period of time if there
are 2000 employees on the payroll.
[0.5768]
3. When packaging a product, a manufacturer
finds that one packet in twenty is underweight.
Determine the probabilities that in a box of
72 packets (a) two and (b) less than four will
be underweight.
[(a) 0.1771 (b) 0.5153]
4. A manufacturer estimates that 0.25% of his
output of a component are defective. The components are marketed in packets of 200. Determine the probability of a packet containing
less than three defective components.
[0.9856]
5. The demand for a particular tool from a store
is, on average, five times a day and the demand
follows a Poisson distribution. How many of
these tools should be kept in the stores so that
the probability of there being one available
when required is greater than 10%?
⎡
⎢
⎢
⎢
⎢
⎢
⎢
⎢
⎢
⎢
⎢
⎢
⎢
⎢
⎣
The probabilities of the demand
for 0, 1, 2, ... tools are
0.0067, 0.0337, 0.0842, 0.1404,
0.1755, 0.1755, 0.1462, 0.1044,
0.0653, ... This shows that the
probability of wanting a tool
8 times a day is 0.0653, i.e.
less than 10%. Hence 7 should
be kept in the store
⎤
⎥
⎥
⎥
⎥
⎥
⎥
⎥
⎥
⎥
⎥
⎥
⎥
⎥
⎦
6. Failure of a group of particular machine
tools follows a Poisson distribution with a
mean value of 0.7. Determine the probabilities of 0, 1, 2, 3, 4 and 5 failures in a week and
present these results on a histogram.
⎡
⎢
⎢
⎢
⎣
Vertical adjacent rectangles
having heights proportional
to 0.4966, 0.3476, 0.1217,
0.0284, 0.0050 and 0.0007
⎤
⎥
⎥
⎥
⎦