

Chapter 14
Trigonometric waveforms
14.1 Graphs of trigonometric
functions
By drawing up tables of values from 0 ◦ to 360 ◦ , graphs
of y = sin A, y = cos A and y = tan A may be plotted.
Values obtained with a calculator (correct to 3 decimal places—which is more than sufficient for plotting
graphs), using 30 ◦ intervals, are shown below, with the
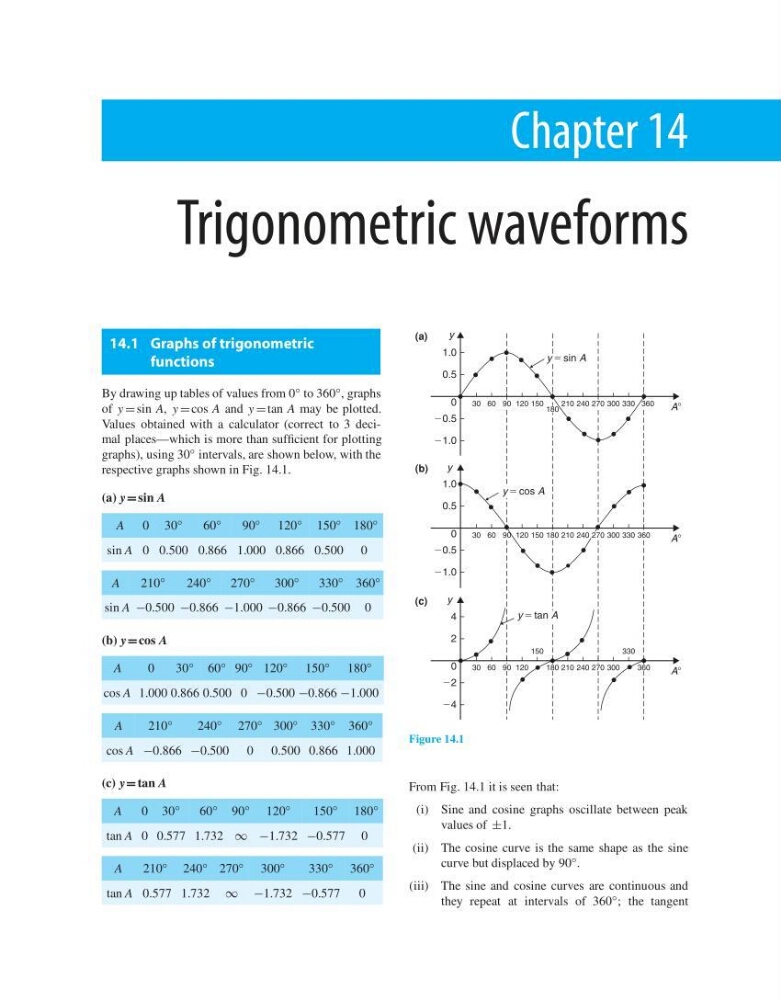
respective graphs shown in Fig. 14.1.
(a) y = sin A
A 0 30 ◦
60 ◦
90 ◦ 120 ◦ 150 ◦ 180 ◦
sin A 0 0.500 0.866 1.000 0.866 0.500 0
A
210 ◦
240 ◦
270 ◦
300 ◦
330 ◦ 360 ◦
sin A −0.500 −0.866 −1.000 −0.866 −0.500 0
(b) y = cos A
A
0
30 ◦ 60 ◦ 90 ◦ 120 ◦ 150 ◦ 180 ◦
cos A 1.000 0.866 0.500 0 −0.500 −0.866 −1.000
A
210 ◦
240 ◦ 270 ◦ 300 ◦ 330 ◦ 360 ◦
cos A −0.866 −0.500 0 0.500 0.866 1.000
(c) y = tan A
A
0 30 ◦
60 ◦ 90 ◦ 120 ◦
150 ◦ 180 ◦
tan A 0 0.577 1.732 ∞ −1.732 −0.577 0
A
210 ◦ 240 ◦ 270 ◦ 300 ◦
330 ◦ 360 ◦
tan A 0.577 1.732 ∞ −1.732 −0.577 0
1.0
21.0
24
20.5
21.0
22
0.5
20.5
0
30 60 90 120 150
180
210 240 270 300 330 360
30 60 90 120
180 210 240 270 300
360
30 60 90 120 150 180 210 240 270 300 330 360
(a)
1.0
0.5
0
(b)
(c)
4
2
0
150
330
y
y
y
y 5 sin A
y 5 tan A
y 5 cos A
A8
A8
A8
Figure 14.1
From Fig. 14.1 it is seen that:
(i) Sine and cosine graphs oscillate between peak
values of ±1.
(ii) The cosine curve is the same shape as the sine
curve but displaced by 90 ◦ .
(iii) The sine and cosine curves are continuous and
they repeat at intervals of 360 ◦ ; the tangent
Trigonometric waveforms
14.1 Graphs of trigonometric
functions
By drawing up tables of values from 0 ◦ to 360 ◦ , graphs
of y = sin A, y = cos A and y = tan A may be plotted.
Values obtained with a calculator (correct to 3 decimal places—which is more than sufficient for plotting
graphs), using 30 ◦ intervals, are shown below, with the
respective graphs shown in Fig. 14.1.
(a) y = sin A
A 0 30 ◦
60 ◦
90 ◦ 120 ◦ 150 ◦ 180 ◦
sin A 0 0.500 0.866 1.000 0.866 0.500 0
A
210 ◦
240 ◦
270 ◦
300 ◦
330 ◦ 360 ◦
sin A −0.500 −0.866 −1.000 −0.866 −0.500 0
(b) y = cos A
A
0
30 ◦ 60 ◦ 90 ◦ 120 ◦ 150 ◦ 180 ◦
cos A 1.000 0.866 0.500 0 −0.500 −0.866 −1.000
A
210 ◦
240 ◦ 270 ◦ 300 ◦ 330 ◦ 360 ◦
cos A −0.866 −0.500 0 0.500 0.866 1.000
(c) y = tan A
A
0 30 ◦
60 ◦ 90 ◦ 120 ◦
150 ◦ 180 ◦
tan A 0 0.577 1.732 ∞ −1.732 −0.577 0
A
210 ◦ 240 ◦ 270 ◦ 300 ◦
330 ◦ 360 ◦
tan A 0.577 1.732 ∞ −1.732 −0.577 0
1.0
21.0
24
20.5
21.0
22
0.5
20.5
0
30 60 90 120 150
180
210 240 270 300 330 360
30 60 90 120
180 210 240 270 300
360
30 60 90 120 150 180 210 240 270 300 330 360
(a)
1.0
0.5
0
(b)
(c)
4
2
0
150
330
y
y
y
y 5 sin A
y 5 tan A
y 5 cos A
A8
A8
A8
Figure 14.1
From Fig. 14.1 it is seen that:
(i) Sine and cosine graphs oscillate between peak
values of ±1.
(ii) The cosine curve is the same shape as the sine
curve but displaced by 90 ◦ .
(iii) The sine and cosine curves are continuous and
they repeat at intervals of 360 ◦ ; the tangent