

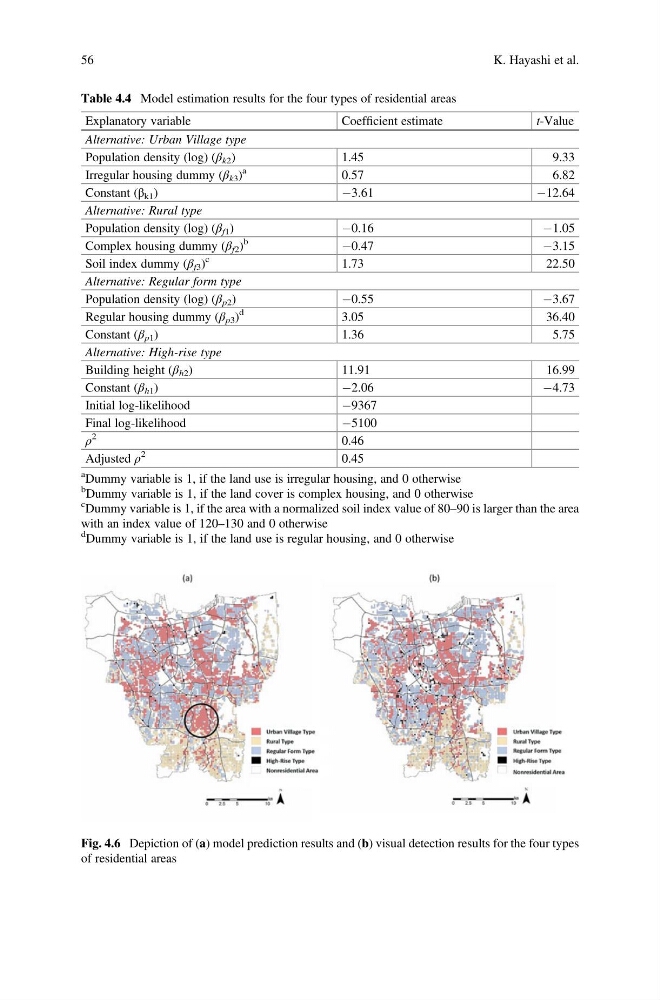
Table 4.4 Model estimation results for the four types of residential areas
Explanatory variable
Coefficient estimate
t-Value
Alternative: Urban Village type
Population density (log) (β k2 )
1.45
9.33
Irregular housing dummy (β k3 )
a
0.57
6.82
Constant (β k1 )
À3.61
À12.64
Alternative: Rural type
Population density (log) (β f1 )
À0.16
À1.05
Complex housing dummy (β f2 )
b
À0.47
À3.15
Soil index dummy (β f3 )
c
1.73
22.50
Alternative: Regular form type
Population density (log) (β p2 )
À0.55
À3.67
Regular housing dummy (β p3 )
d
3.05
36.40
Constant (β p1 )
1.36
5.75
Alternative: High-rise type
Building height (β h2 )
11.91
16.99
Constant (β h1 )
À2.06
À4.73
Initial log-likelihood
À9367
Final log-likelihood
À5100
ρ
2
0.46
Adjusted ρ
2
0.45
a Dummy variable is 1, if the land use is irregular housing, and 0 otherwise
b
Dummy variable is 1, if the land cover is complex housing, and 0 otherwise
c Dummy variable is 1, if the area with a normalized soil index value of 80–90 is larger than the area
with an index value of 120–130 and 0 otherwise
d
Dummy variable is 1, if the land use is regular housing, and 0 otherwise
Fig. 4.6 Depiction of (a) model prediction results and (b) visual detection results for the four types
of residential areas
56
K. Hayashi et al.
Explanatory variable
Coefficient estimate
t-Value
Alternative: Urban Village type
Population density (log) (β k2 )
1.45
9.33
Irregular housing dummy (β k3 )
a
0.57
6.82
Constant (β k1 )
À3.61
À12.64
Alternative: Rural type
Population density (log) (β f1 )
À0.16
À1.05
Complex housing dummy (β f2 )
b
À0.47
À3.15
Soil index dummy (β f3 )
c
1.73
22.50
Alternative: Regular form type
Population density (log) (β p2 )
À0.55
À3.67
Regular housing dummy (β p3 )
d
3.05
36.40
Constant (β p1 )
1.36
5.75
Alternative: High-rise type
Building height (β h2 )
11.91
16.99
Constant (β h1 )
À2.06
À4.73
Initial log-likelihood
À9367
Final log-likelihood
À5100
ρ
2
0.46
Adjusted ρ
2
0.45
a Dummy variable is 1, if the land use is irregular housing, and 0 otherwise
b
Dummy variable is 1, if the land cover is complex housing, and 0 otherwise
c Dummy variable is 1, if the area with a normalized soil index value of 80–90 is larger than the area
with an index value of 120–130 and 0 otherwise
d
Dummy variable is 1, if the land use is regular housing, and 0 otherwise
Fig. 4.6 Depiction of (a) model prediction results and (b) visual detection results for the four types
of residential areas
56
K. Hayashi et al.