

sufficiently conceivable. Furthermore, while certain indicators should be classified
as limiting indicators from a conceptual perspective, in their actual application they
may have to be tentatively treated in a manner like maximization indicators due to
the lack of clarity in their thresholds, which is the specific assessment standard. For
instance, discharge of waste is tentatively classified as a maximization indicator, and
it would not be unusual at all if there were applicable thresholds. Furthermore, like
the rate of school attendance or rate of access to safe drinking water, conceptually, it
is obvious that 100% is ideal. In the practical application of the assessment however
it is extremely difficult to decide where to set the threshold for these indicators.
Regarding views on individual indicators, advances in scientific research regarding
individual indicators are essential. In the selection of indicators and assessment
methods, a scientific basis should be sought wherever possible and a scientific
format adopted. At the same time however there is an art-like aspect in the selection
of indicators.
Although a list of indicators is given in Table 9.1, I have not yet succeeded in
assigning standards for measuring and assessing all of these indicators. There are
some indicators for which acquisition of data and evaluative judgments are not yet
possible, and for these it will be necessary to wait for the development of relevant
scientific knowledge. In view of this situation, we created a prototype using a limited
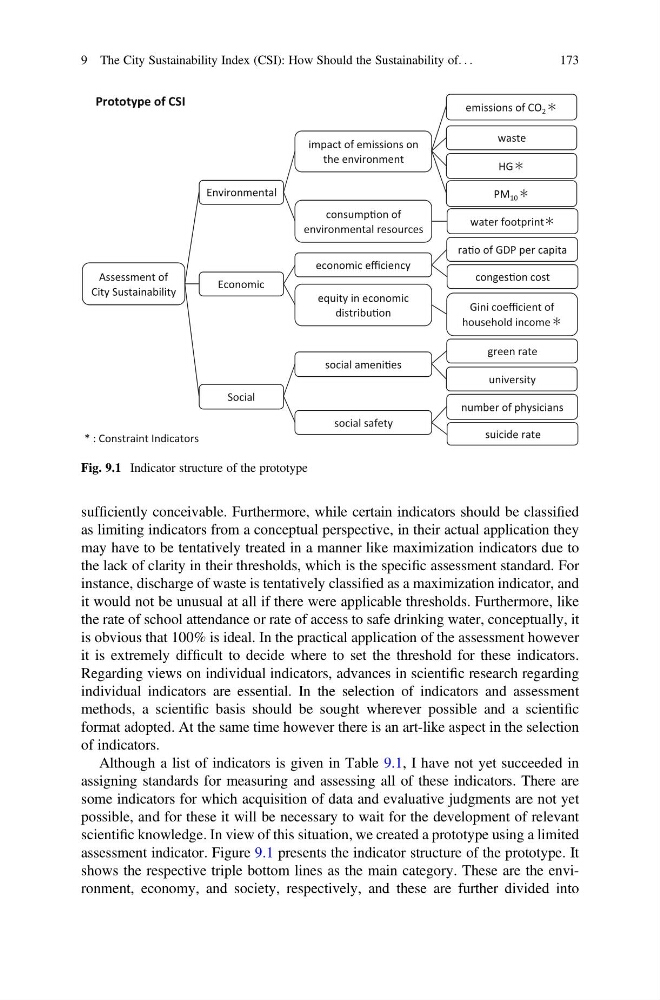
assessment indicator. Figure 9.1 presents the indicator structure of the prototype. It
shows the respective triple bottom lines as the main category. These are the environment, economy, and society, respectively, and these are further divided into
Prototype of CSI
* : Constraint Indicators
Assessment of
City Sustainability
Environmental
Economic
Social
impact of emissions on
the environment
consumpƟon of
environmental resources
economic efficiency
equity in economic
distribuƟon
social ameniƟes
social safety
emissions of CO 2
water footprint
raƟo of GDP per capita
Gini coefficient of
household income
green rate
number of physicians
waste
HG
PM 10
congesƟon cost
university
suicide rate
Fig. 9.1 Indicator structure of the prototype
9 The City Sustainability Index (CSI): How Should the Sustainability of. . .
173
as limiting indicators from a conceptual perspective, in their actual application they
may have to be tentatively treated in a manner like maximization indicators due to
the lack of clarity in their thresholds, which is the specific assessment standard. For
instance, discharge of waste is tentatively classified as a maximization indicator, and
it would not be unusual at all if there were applicable thresholds. Furthermore, like
the rate of school attendance or rate of access to safe drinking water, conceptually, it
is obvious that 100% is ideal. In the practical application of the assessment however
it is extremely difficult to decide where to set the threshold for these indicators.
Regarding views on individual indicators, advances in scientific research regarding
individual indicators are essential. In the selection of indicators and assessment
methods, a scientific basis should be sought wherever possible and a scientific
format adopted. At the same time however there is an art-like aspect in the selection
of indicators.
Although a list of indicators is given in Table 9.1, I have not yet succeeded in
assigning standards for measuring and assessing all of these indicators. There are
some indicators for which acquisition of data and evaluative judgments are not yet
possible, and for these it will be necessary to wait for the development of relevant
scientific knowledge. In view of this situation, we created a prototype using a limited
assessment indicator. Figure 9.1 presents the indicator structure of the prototype. It
shows the respective triple bottom lines as the main category. These are the environment, economy, and society, respectively, and these are further divided into
Prototype of CSI
* : Constraint Indicators
Assessment of
City Sustainability
Environmental
Economic
Social
impact of emissions on
the environment
consumpƟon of
environmental resources
economic efficiency
equity in economic
distribuƟon
social ameniƟes
social safety
emissions of CO 2
water footprint
raƟo of GDP per capita
Gini coefficient of
household income
green rate
number of physicians
waste
HG
PM 10
congesƟon cost
university
suicide rate
Fig. 9.1 Indicator structure of the prototype
9 The City Sustainability Index (CSI): How Should the Sustainability of. . .
173