

such as the Gini coefficient of household income, poverty rate, and rate or access to
safe drinking water, are also indicators that belong to this type. Next, the maximization indicator is an indicator for measuring the scale of benefits (there are both
positive and negative benefits) a city creates in economic and social aspects. For
example, per capita GDP, total investment in infrastructure, traffic congestion costs,
increases in residential costs, rate of coverage of public transportation, crime rate,
and suicide rate are indicators of this type.
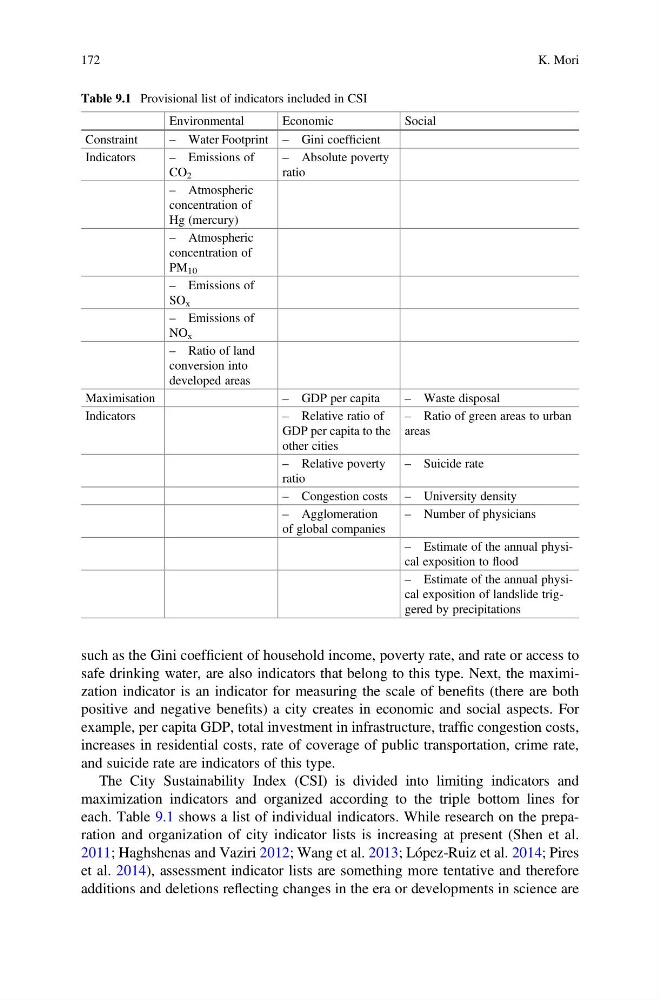
The City Sustainability Index (CSI) is divided into limiting indicators and
maximization indicators and organized according to the triple bottom lines for
each. Table 9.1 shows a list of individual indicators. While research on the preparation and organization of city indicator lists is increasing at present (Shen et al.
2011; Haghshenas and Vaziri 2012; Wang et al. 2013; López-Ruiz et al. 2014; Pires
et al. 2014), assessment indicator lists are something more tentative and therefore
additions and deletions reflecting changes in the era or developments in science are
Table 9.1 Provisional list of indicators included in CSI
Environmental
Economic
Social
Constraint
– Water Footprint – Gini coefficient
Indicators
– Emissions of
CO 2
– Absolute poverty
ratio
– Atmospheric
concentration of
Hg (mercury)
– Atmospheric
concentration of
PM 10
– Emissions of
SO x
– Emissions of
NO x
– Ratio of land
conversion into
developed areas
Maximisation
– GDP per capita
– Waste disposal
Indicators
– Relative ratio of
GDP per capita to the
other cities
– Ratio of green areas to urban
areas
– Relative poverty
ratio
– Suicide rate
– Congestion costs – University density
– Agglomeration
of global companies
– Number of physicians
– Estimate of the annual physical exposition to flood
– Estimate of the annual physical exposition of landslide triggered by precipitations
172
K. Mori
safe drinking water, are also indicators that belong to this type. Next, the maximization indicator is an indicator for measuring the scale of benefits (there are both
positive and negative benefits) a city creates in economic and social aspects. For
example, per capita GDP, total investment in infrastructure, traffic congestion costs,
increases in residential costs, rate of coverage of public transportation, crime rate,
and suicide rate are indicators of this type.
The City Sustainability Index (CSI) is divided into limiting indicators and
maximization indicators and organized according to the triple bottom lines for
each. Table 9.1 shows a list of individual indicators. While research on the preparation and organization of city indicator lists is increasing at present (Shen et al.
2011; Haghshenas and Vaziri 2012; Wang et al. 2013; López-Ruiz et al. 2014; Pires
et al. 2014), assessment indicator lists are something more tentative and therefore
additions and deletions reflecting changes in the era or developments in science are
Table 9.1 Provisional list of indicators included in CSI
Environmental
Economic
Social
Constraint
– Water Footprint – Gini coefficient
Indicators
– Emissions of
CO 2
– Absolute poverty
ratio
– Atmospheric
concentration of
Hg (mercury)
– Atmospheric
concentration of
PM 10
– Emissions of
SO x
– Emissions of
NO x
– Ratio of land
conversion into
developed areas
Maximisation
– GDP per capita
– Waste disposal
Indicators
– Relative ratio of
GDP per capita to the
other cities
– Ratio of green areas to urban
areas
– Relative poverty
ratio
– Suicide rate
– Congestion costs – University density
– Agglomeration
of global companies
– Number of physicians
– Estimate of the annual physical exposition to flood
– Estimate of the annual physical exposition of landslide triggered by precipitations
172
K. Mori