

values greater than 1 and showed that the greater the value, the more complex the
urban area formed.
In addition to an RPI, in this research, we also used the average population
density inside an urban area as an indicator of degree of compactness. For compact
city policy purposes, population density is a good representative indicator that
should be set at a certain high level from the viewpoint of environmental efficiency.
Furthermore, while an RPI is a direct indicator of an urban area’s physical,
two-dimensional pattern of expansion, population density shows the degree of
population accumulation within an urban area and so in a sense is an indicator that
demonstrates the degree of a city’s vertical expansion. For that reason, the two
indicators can be said to complement each other in any analysis of urban
morphologies.
6.2.1.2 The Degree of Compactness of Cities
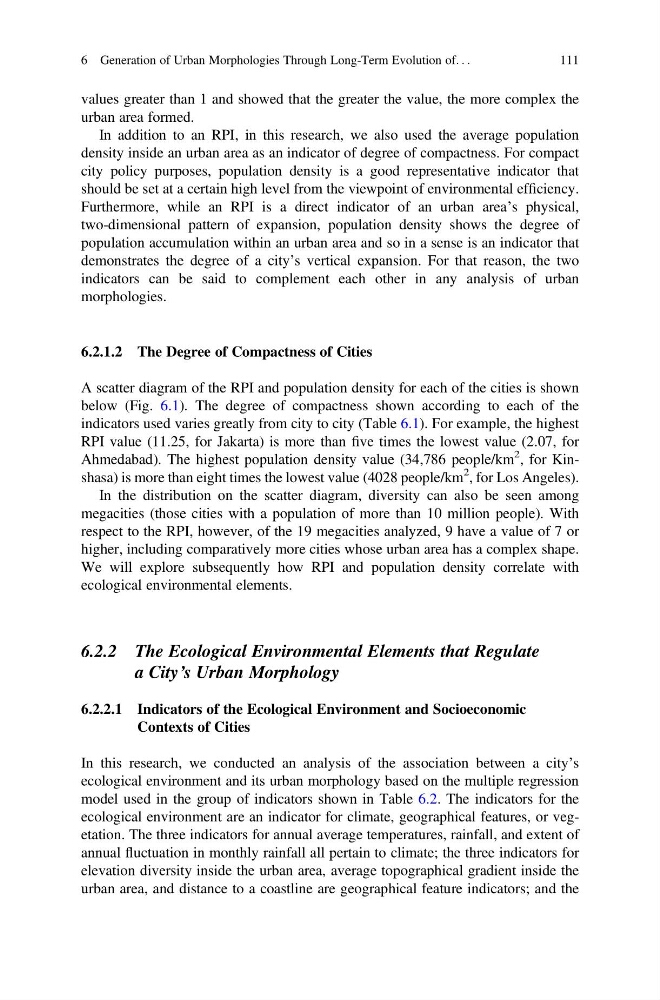
A scatter diagram of the RPI and population density for each of the cities is shown
below (Fig. 6.1). The degree of compactness shown according to each of the
indicators used varies greatly from city to city (Table 6.1). For example, the highest
RPI value (11.25, for Jakarta) is more than five times the lowest value (2.07, for
Ahmedabad). The highest population density value (34,786 people/km
2 , for Kinshasa) is more than eight times the lowest value (4028 people/km
2 , for Los Angeles).
In the distribution on the scatter diagram, diversity can also be seen among
megacities (those cities with a population of more than 10 million people). With
respect to the RPI, however, of the 19 megacities analyzed, 9 have a value of 7 or
higher, including comparatively more cities whose urban area has a complex shape.
We will explore subsequently how RPI and population density correlate with
ecological environmental elements.
6.2.2 The Ecological Environmental Elements that Regulate
a City’s Urban Morphology
6.2.2.1 Indicators of the Ecological Environment and Socioeconomic
Contexts of Cities
In this research, we conducted an analysis of the association between a city’s
ecological environment and its urban morphology based on the multiple regression
model used in the group of indicators shown in Table 6.2. The indicators for the
ecological environment are an indicator for climate, geographical features, or vegetation. The three indicators for annual average temperatures, rainfall, and extent of
annual fluctuation in monthly rainfall all pertain to climate; the three indicators for
elevation diversity inside the urban area, average topographical gradient inside the
urban area, and distance to a coastline are geographical feature indicators; and the
6 Generation of Urban Morphologies Through Long-Term Evolution of. . .
111
urban area formed.
In addition to an RPI, in this research, we also used the average population
density inside an urban area as an indicator of degree of compactness. For compact
city policy purposes, population density is a good representative indicator that
should be set at a certain high level from the viewpoint of environmental efficiency.
Furthermore, while an RPI is a direct indicator of an urban area’s physical,
two-dimensional pattern of expansion, population density shows the degree of
population accumulation within an urban area and so in a sense is an indicator that
demonstrates the degree of a city’s vertical expansion. For that reason, the two
indicators can be said to complement each other in any analysis of urban
morphologies.
6.2.1.2 The Degree of Compactness of Cities
A scatter diagram of the RPI and population density for each of the cities is shown
below (Fig. 6.1). The degree of compactness shown according to each of the
indicators used varies greatly from city to city (Table 6.1). For example, the highest
RPI value (11.25, for Jakarta) is more than five times the lowest value (2.07, for
Ahmedabad). The highest population density value (34,786 people/km
2 , for Kinshasa) is more than eight times the lowest value (4028 people/km
2 , for Los Angeles).
In the distribution on the scatter diagram, diversity can also be seen among
megacities (those cities with a population of more than 10 million people). With
respect to the RPI, however, of the 19 megacities analyzed, 9 have a value of 7 or
higher, including comparatively more cities whose urban area has a complex shape.
We will explore subsequently how RPI and population density correlate with
ecological environmental elements.
6.2.2 The Ecological Environmental Elements that Regulate
a City’s Urban Morphology
6.2.2.1 Indicators of the Ecological Environment and Socioeconomic
Contexts of Cities
In this research, we conducted an analysis of the association between a city’s
ecological environment and its urban morphology based on the multiple regression
model used in the group of indicators shown in Table 6.2. The indicators for the
ecological environment are an indicator for climate, geographical features, or vegetation. The three indicators for annual average temperatures, rainfall, and extent of
annual fluctuation in monthly rainfall all pertain to climate; the three indicators for
elevation diversity inside the urban area, average topographical gradient inside the
urban area, and distance to a coastline are geographical feature indicators; and the
6 Generation of Urban Morphologies Through Long-Term Evolution of. . .
111