

how the extent of the urban area is identified. In our analysis in this chapter, we used
the reciprocal of an indicator reviewed by Angel et al. as a perimeter indicator (PI)—
that is, an RPI. The PI was calculated by dividing the perimeter of a circle with the
same size as the relevant urban area by the actual perimeter of that urban area. The
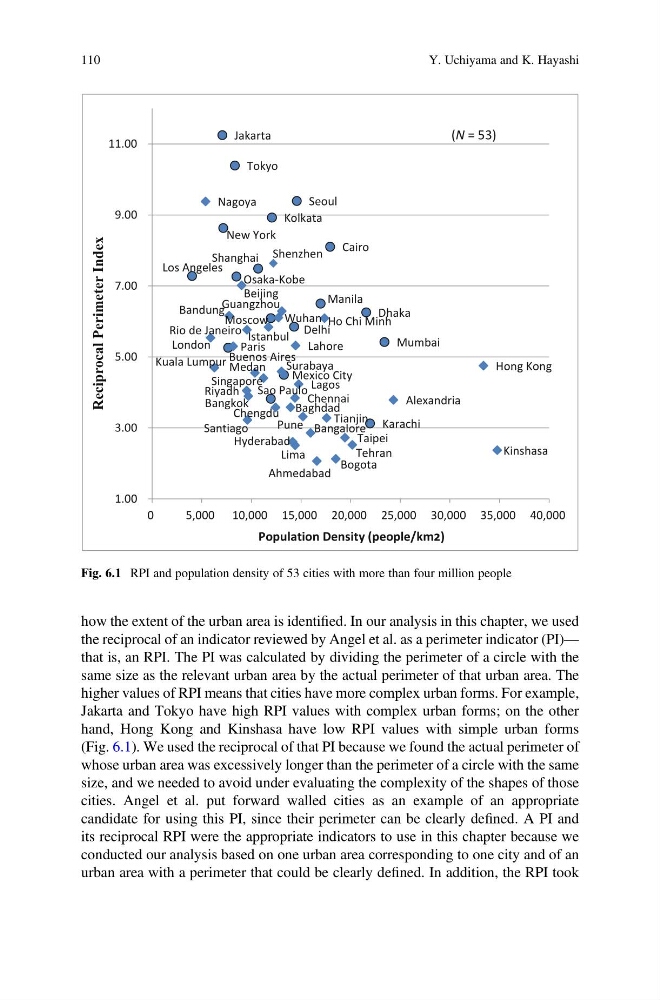
higher values of RPI means that cities have more complex urban forms. For example,
Jakarta and Tokyo have high RPI values with complex urban forms; on the other
hand, Hong Kong and Kinshasa have low RPI values with simple urban forms
(Fig. 6.1). We used the reciprocal of that PI because we found the actual perimeter of
whose urban area was excessively longer than the perimeter of a circle with the same
size, and we needed to avoid under evaluating the complexity of the shapes of those
cities. Angel et al. put forward walled cities as an example of an appropriate
candidate for using this PI, since their perimeter can be clearly defined. A PI and
its reciprocal RPI were the appropriate indicators to use in this chapter because we
conducted our analysis based on one urban area corresponding to one city and of an
urban area with a perimeter that could be clearly defined. In addition, the RPI took
Tokyo
Jakarta
Seoul
Mumbai
Sao Paulo
Mexico City
Delhi
Manila
Cairo
Kolkata
Osaka-Kobe
Shanghai
Buenos Aires
New York
Karachi
Dhaka
Moscow
Los Angeles
Istanbul
Beijing
Rio de Janeiro
Paris
Lima
Tehran
Guangzhou
Lagos
Chennai
London
Bogota
Bangkok
Lahore
Shenzhen
Kinshasa
Hyderabad
Taipei
Surabaya
Bangalore
Bandung
Baghdad
Santiago
Singapore
Ahmedabad
Wuhan
Nagoya
Tianjin
Riyadh
Ho Chi Minh
Kuala Lumpur
Pune
Hong Kong
Chengdu
Alexandria
Medan
1.00
3.00
5.00
7.00
9.00
11.00
0
5,000 10,000 15,000 20,000 25,000 30,000 35,000 40,000
Population Density (people/km2)
(N = 53)
Reciprocal Perimeter Index
Fig. 6.1 RPI and population density of 53 cities with more than four million people
110
Y. Uchiyama and K. Hayashi
the reciprocal of an indicator reviewed by Angel et al. as a perimeter indicator (PI)—
that is, an RPI. The PI was calculated by dividing the perimeter of a circle with the
same size as the relevant urban area by the actual perimeter of that urban area. The
higher values of RPI means that cities have more complex urban forms. For example,
Jakarta and Tokyo have high RPI values with complex urban forms; on the other
hand, Hong Kong and Kinshasa have low RPI values with simple urban forms
(Fig. 6.1). We used the reciprocal of that PI because we found the actual perimeter of
whose urban area was excessively longer than the perimeter of a circle with the same
size, and we needed to avoid under evaluating the complexity of the shapes of those
cities. Angel et al. put forward walled cities as an example of an appropriate
candidate for using this PI, since their perimeter can be clearly defined. A PI and
its reciprocal RPI were the appropriate indicators to use in this chapter because we
conducted our analysis based on one urban area corresponding to one city and of an
urban area with a perimeter that could be clearly defined. In addition, the RPI took
Tokyo
Jakarta
Seoul
Mumbai
Sao Paulo
Mexico City
Delhi
Manila
Cairo
Kolkata
Osaka-Kobe
Shanghai
Buenos Aires
New York
Karachi
Dhaka
Moscow
Los Angeles
Istanbul
Beijing
Rio de Janeiro
Paris
Lima
Tehran
Guangzhou
Lagos
Chennai
London
Bogota
Bangkok
Lahore
Shenzhen
Kinshasa
Hyderabad
Taipei
Surabaya
Bangalore
Bandung
Baghdad
Santiago
Singapore
Ahmedabad
Wuhan
Nagoya
Tianjin
Riyadh
Ho Chi Minh
Kuala Lumpur
Pune
Hong Kong
Chengdu
Alexandria
Medan
1.00
3.00
5.00
7.00
9.00
11.00
0
5,000 10,000 15,000 20,000 25,000 30,000 35,000 40,000
Population Density (people/km2)
(N = 53)
Reciprocal Perimeter Index
Fig. 6.1 RPI and population density of 53 cities with more than four million people
110
Y. Uchiyama and K. Hayashi