

46
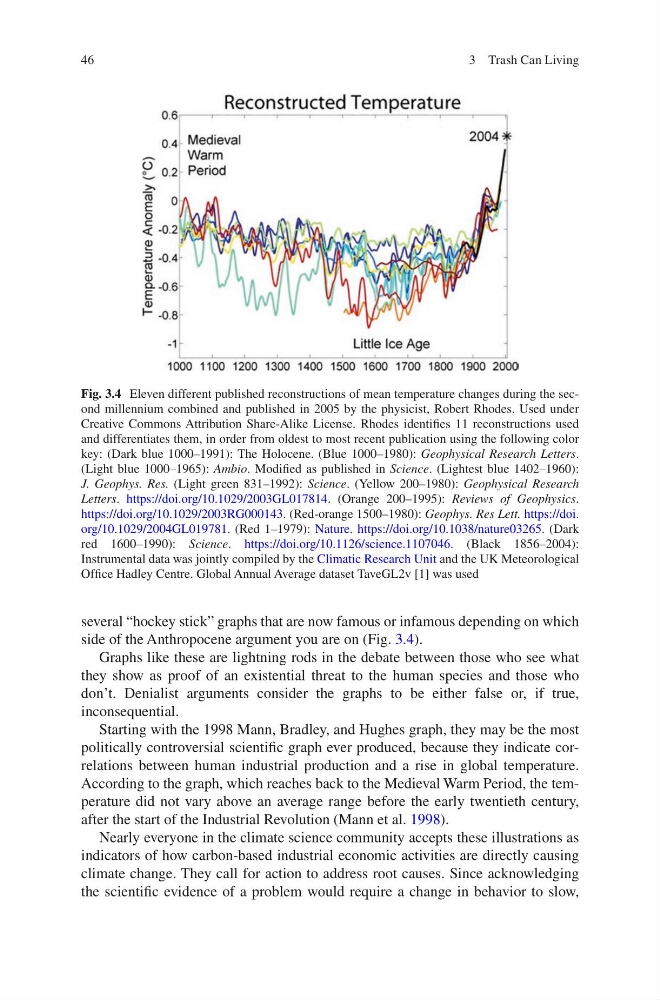
several “hockey stick” graphs that are now famous or infamous depending on which
side of the Anthropocene argument you are on (Fig. 3.4).
Graphs like these are lightning rods in the debate between those who see what
they show as proof of an existential threat to the human species and those who
don’t. Denialist arguments consider the graphs to be either false or, if true,
inconsequential.
Starting with the 1998 Mann, Bradley, and Hughes graph, they may be the most
politically controversial scientific graph ever produced, because they indicate correlations between human industrial production and a rise in global temperature.
According to the graph, which reaches back to the Medieval Warm Period, the temperature did not vary above an average range before the early twentieth century,
after the start of the Industrial Revolution (Mann et al. 1998).
Nearly everyone in the climate science community accepts these illustrations as
indicators of how carbon-based industrial economic activities are directly causing
climate change. They call for action to address root causes. Since acknowledging
the scientific evidence of a problem would require a change in behavior to slow,
Fig. 3.4 Eleven different published reconstructions of mean temperature changes during the second millennium combined and published in 2005 by the physicist, Robert Rhodes. Used under
Creative Commons Attribution Share-Alike License. Rhodes identifies 11 reconstructions used
and differentiates them, in order from oldest to most recent publication using the following color
key: (Dark blue 1000–1991): The Holocene. (Blue 1000–1980): Geophysical Research Letters.
(Light blue 1000–1965): Ambio. Modified as published in Science. (Lightest blue 1402–1960):
J. Geophys. Res. (Light green 831–1992): Science. (Yellow 200–1980): Geophysical Research
Letters. https://doi.org/10.1029/2003GL017814. (Orange 200–1995): Reviews of Geophysics.
https://doi.org/10.1029/2003RG000143. (Red-orange 1500–1980): Geophys. Res Lett. https://doi.
org/10.1029/2004GL019781. (Red 1–1979): Nature. https://doi.org/10.1038/nature03265. (Dark
red 1600–1990): Science. https://doi.org/10.1126/science.1107046. (Black 1856–2004):
Instrumental data was jointly compiled by the Climatic Research Unit and the UK Meteorological
Office Hadley Centre. Global Annual Average dataset TaveGL2v [1] was used
3 Trash Can Living
several “hockey stick” graphs that are now famous or infamous depending on which
side of the Anthropocene argument you are on (Fig. 3.4).
Graphs like these are lightning rods in the debate between those who see what
they show as proof of an existential threat to the human species and those who
don’t. Denialist arguments consider the graphs to be either false or, if true,
inconsequential.
Starting with the 1998 Mann, Bradley, and Hughes graph, they may be the most
politically controversial scientific graph ever produced, because they indicate correlations between human industrial production and a rise in global temperature.
According to the graph, which reaches back to the Medieval Warm Period, the temperature did not vary above an average range before the early twentieth century,
after the start of the Industrial Revolution (Mann et al. 1998).
Nearly everyone in the climate science community accepts these illustrations as
indicators of how carbon-based industrial economic activities are directly causing
climate change. They call for action to address root causes. Since acknowledging
the scientific evidence of a problem would require a change in behavior to slow,
Fig. 3.4 Eleven different published reconstructions of mean temperature changes during the second millennium combined and published in 2005 by the physicist, Robert Rhodes. Used under
Creative Commons Attribution Share-Alike License. Rhodes identifies 11 reconstructions used
and differentiates them, in order from oldest to most recent publication using the following color
key: (Dark blue 1000–1991): The Holocene. (Blue 1000–1980): Geophysical Research Letters.
(Light blue 1000–1965): Ambio. Modified as published in Science. (Lightest blue 1402–1960):
J. Geophys. Res. (Light green 831–1992): Science. (Yellow 200–1980): Geophysical Research
Letters. https://doi.org/10.1029/2003GL017814. (Orange 200–1995): Reviews of Geophysics.
https://doi.org/10.1029/2003RG000143. (Red-orange 1500–1980): Geophys. Res Lett. https://doi.
org/10.1029/2004GL019781. (Red 1–1979): Nature. https://doi.org/10.1038/nature03265. (Dark
red 1600–1990): Science. https://doi.org/10.1126/science.1107046. (Black 1856–2004):
Instrumental data was jointly compiled by the Climatic Research Unit and the UK Meteorological
Office Hadley Centre. Global Annual Average dataset TaveGL2v [1] was used
3 Trash Can Living