

45
trapped in ice and snow above glaciers (Etheddge and Steele 1996). Equivalent CO 2
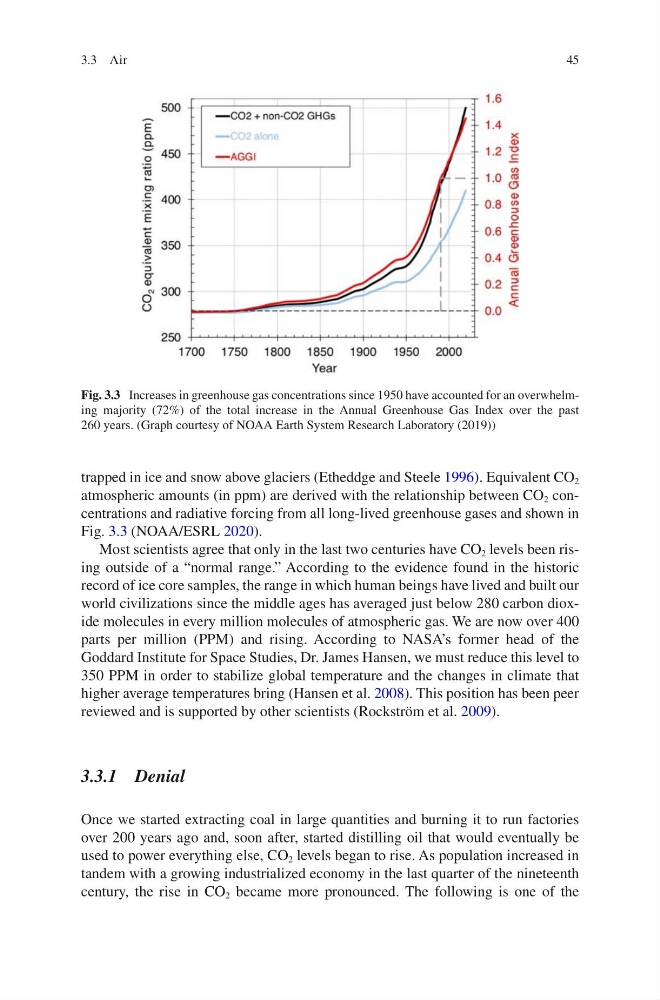
atmospheric amounts (in ppm) are derived with the relationship between CO 2 concentrations and radiative forcing from all long-lived greenhouse gases and shown in
Fig. 3.3 (NOAA/ESRL 2020).
Most scientists agree that only in the last two centuries have CO 2 levels been rising outside of a “normal range.” According to the evidence found in the historic
record of ice core samples, the range in which human beings have lived and built our
world civilizations since the middle ages has averaged just below 280 carbon dioxide molecules in every million molecules of atmospheric gas. We are now over 400
parts per million (PPM) and rising. According to NASA’s former head of the
Goddard Institute for Space Studies, Dr. James Hansen, we must reduce this level to
350 PPM in order to stabilize global temperature and the changes in climate that
higher average temperatures bring (Hansen et al. 2008). This position has been peer
reviewed and is supported by other scientists (Rockström et al. 2009).
3.3.1 Denial
Once we started extracting coal in large quantities and burning it to run factories
over 200 years ago and, soon after, started distilling oil that would eventually be
used to power everything else, CO 2 levels began to rise. As population increased in
tandem with a growing industrialized economy in the last quarter of the nineteenth
century, the rise in CO 2 became more pronounced. The following is one of the
Fig. 3.3 Increases in greenhouse gas concentrations since 1950 have accounted for an overwhelming majority (72%) of the total increase in the Annual Greenhouse Gas Index over the past
260 years. (Graph courtesy of NOAA Earth System Research Laboratory (2019))
3.3 Air
trapped in ice and snow above glaciers (Etheddge and Steele 1996). Equivalent CO 2
atmospheric amounts (in ppm) are derived with the relationship between CO 2 concentrations and radiative forcing from all long-lived greenhouse gases and shown in
Fig. 3.3 (NOAA/ESRL 2020).
Most scientists agree that only in the last two centuries have CO 2 levels been rising outside of a “normal range.” According to the evidence found in the historic
record of ice core samples, the range in which human beings have lived and built our
world civilizations since the middle ages has averaged just below 280 carbon dioxide molecules in every million molecules of atmospheric gas. We are now over 400
parts per million (PPM) and rising. According to NASA’s former head of the
Goddard Institute for Space Studies, Dr. James Hansen, we must reduce this level to
350 PPM in order to stabilize global temperature and the changes in climate that
higher average temperatures bring (Hansen et al. 2008). This position has been peer
reviewed and is supported by other scientists (Rockström et al. 2009).
3.3.1 Denial
Once we started extracting coal in large quantities and burning it to run factories
over 200 years ago and, soon after, started distilling oil that would eventually be
used to power everything else, CO 2 levels began to rise. As population increased in
tandem with a growing industrialized economy in the last quarter of the nineteenth
century, the rise in CO 2 became more pronounced. The following is one of the
Fig. 3.3 Increases in greenhouse gas concentrations since 1950 have accounted for an overwhelming majority (72%) of the total increase in the Annual Greenhouse Gas Index over the past
260 years. (Graph courtesy of NOAA Earth System Research Laboratory (2019))
3.3 Air