

192
compared to using new materials (Erduran et al. 2020). A study completed by
Thormark (2000) shows approximately a 50% reduction in cradle-to-gate embodied
energy when using a substantial quantity of reclaimed building materials, even with
the impacts associated with refurbishing the materials and transporting them to a
new location.
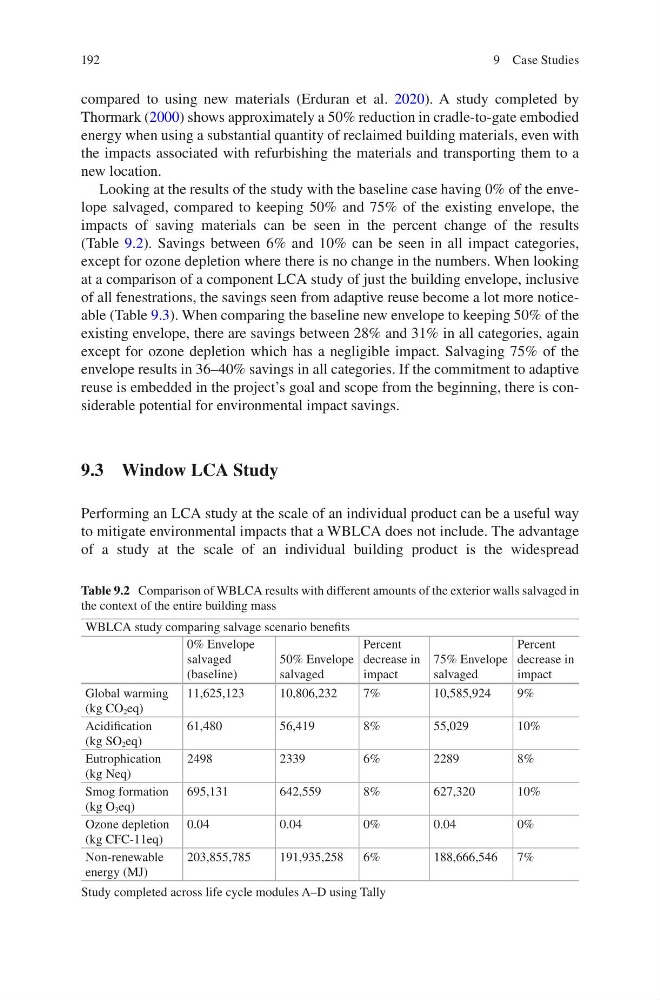
Looking at the results of the study with the baseline case having 0% of the envelope salvaged, compared to keeping 50% and 75% of the existing envelope, the
impacts of saving materials can be seen in the percent change of the results
(Table 9.2). Savings between 6% and 10% can be seen in all impact categories,
except for ozone depletion where there is no change in the numbers. When looking
at a comparison of a component LCA study of just the building envelope, inclusive
of all fenestrations, the savings seen from adaptive reuse become a lot more noticeable (Table 9.3). When comparing the baseline new envelope to keeping 50% of the
existing envelope, there are savings between 28% and 31% in all categories, again
except for ozone depletion which has a negligible impact. Salvaging 75% of the
envelope results in 36–40% savings in all categories. If the commitment to adaptive
reuse is embedded in the project’s goal and scope from the beginning, there is considerable potential for environmental impact savings.
9.3 Window LCA Study
Performing an LCA study at the scale of an individual product can be a useful way
to mitigate environmental impacts that a WBLCA does not include. The advantage
of a study at the scale of an individual building product is the widespread
Table 9.2 Comparison of WBLCA results with different amounts of the exterior walls salvaged in
the context of the entire building mass
WBLCA study comparing salvage scenario benefits
0% Envelope
salvaged
(baseline)
50% Envelope
salvaged
Percent
decrease in
impact
75% Envelope
salvaged
Percent
decrease in
impact
Global warming
(kg CO 2 eq)
11,625,123
10,806,232
7%
10,585,924
9%
Acidification
(kg SO 2 eq)
61,480
56,419
8%
55,029
10%
Eutrophication
(kg Neq)
2498
2339
6%
2289
8%
Smog formation
(kg O 3 eq)
695,131
642,559
8%
627,320
10%
Ozone depletion
(kg CFC-11eq)
0.04
0.04
0%
0.04
0%
Non-renewable
energy (MJ)
203,855,785
191,935,258
6%
188,666,546
7%
Study completed across life cycle modules A–D using Tally
9 Case Studies
compared to using new materials (Erduran et al. 2020). A study completed by
Thormark (2000) shows approximately a 50% reduction in cradle-to-gate embodied
energy when using a substantial quantity of reclaimed building materials, even with
the impacts associated with refurbishing the materials and transporting them to a
new location.
Looking at the results of the study with the baseline case having 0% of the envelope salvaged, compared to keeping 50% and 75% of the existing envelope, the
impacts of saving materials can be seen in the percent change of the results
(Table 9.2). Savings between 6% and 10% can be seen in all impact categories,
except for ozone depletion where there is no change in the numbers. When looking
at a comparison of a component LCA study of just the building envelope, inclusive
of all fenestrations, the savings seen from adaptive reuse become a lot more noticeable (Table 9.3). When comparing the baseline new envelope to keeping 50% of the
existing envelope, there are savings between 28% and 31% in all categories, again
except for ozone depletion which has a negligible impact. Salvaging 75% of the
envelope results in 36–40% savings in all categories. If the commitment to adaptive
reuse is embedded in the project’s goal and scope from the beginning, there is considerable potential for environmental impact savings.
9.3 Window LCA Study
Performing an LCA study at the scale of an individual product can be a useful way
to mitigate environmental impacts that a WBLCA does not include. The advantage
of a study at the scale of an individual building product is the widespread
Table 9.2 Comparison of WBLCA results with different amounts of the exterior walls salvaged in
the context of the entire building mass
WBLCA study comparing salvage scenario benefits
0% Envelope
salvaged
(baseline)
50% Envelope
salvaged
Percent
decrease in
impact
75% Envelope
salvaged
Percent
decrease in
impact
Global warming
(kg CO 2 eq)
11,625,123
10,806,232
7%
10,585,924
9%
Acidification
(kg SO 2 eq)
61,480
56,419
8%
55,029
10%
Eutrophication
(kg Neq)
2498
2339
6%
2289
8%
Smog formation
(kg O 3 eq)
695,131
642,559
8%
627,320
10%
Ozone depletion
(kg CFC-11eq)
0.04
0.04
0%
0.04
0%
Non-renewable
energy (MJ)
203,855,785
191,935,258
6%
188,666,546
7%
Study completed across life cycle modules A–D using Tally
9 Case Studies