

160
contributing materials (Global Warming)” which breaks down the cradle-to-gate
(A1–A3) GWP by One Click LCA material. This is a useful way to identify targeted
areas to make improvements in the design that will have the most impact on total
results in this one impact category as shown in Sect. 9.1.2. After this the results are
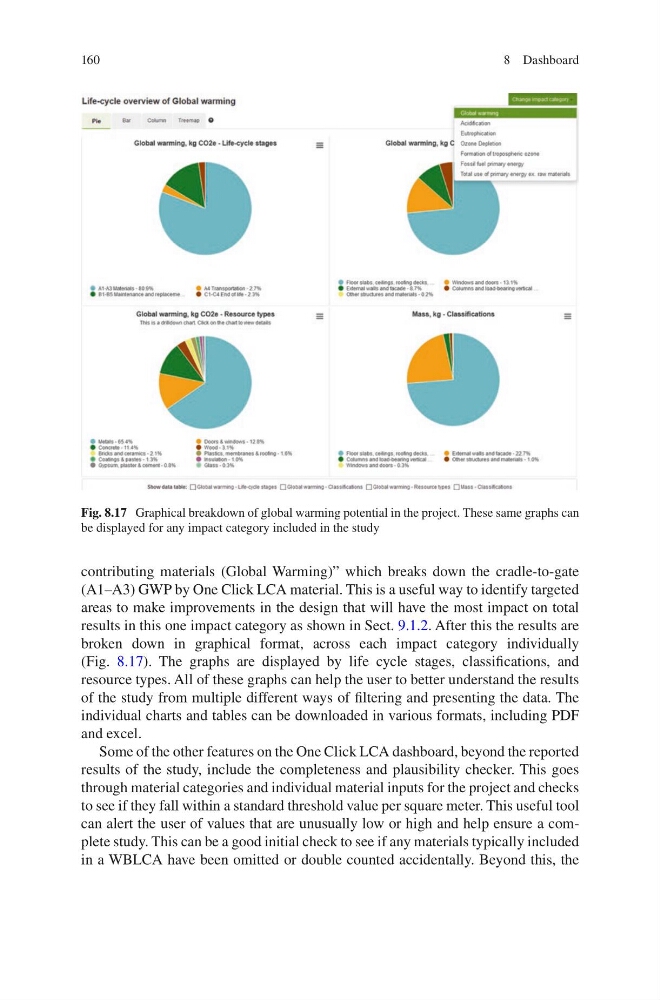
broken down in graphical format, across each impact category individually
(Fig. 8.17). The graphs are displayed by life cycle stages, classifications, and
resource types. All of these graphs can help the user to better understand the results
of the study from multiple different ways of filtering and presenting the data. The
individual charts and tables can be downloaded in various formats, including PDF
and excel.
Some of the other features on the One Click LCA dashboard, beyond the reported
results of the study, include the completeness and plausibility checker. This goes
through material categories and individual material inputs for the project and checks
to see if they fall within a standard threshold value per square meter. This useful tool
can alert the user of values that are unusually low or high and help ensure a complete study. This can be a good initial check to see if any materials typically included
in a WBLCA have been omitted or double counted accidentally. Beyond this, the
Fig. 8.17 Graphical breakdown of global warming potential in the project. These same graphs can
be displayed for any impact category included in the study
8 Dashboard
contributing materials (Global Warming)” which breaks down the cradle-to-gate
(A1–A3) GWP by One Click LCA material. This is a useful way to identify targeted
areas to make improvements in the design that will have the most impact on total
results in this one impact category as shown in Sect. 9.1.2. After this the results are
broken down in graphical format, across each impact category individually
(Fig. 8.17). The graphs are displayed by life cycle stages, classifications, and
resource types. All of these graphs can help the user to better understand the results
of the study from multiple different ways of filtering and presenting the data. The
individual charts and tables can be downloaded in various formats, including PDF
and excel.
Some of the other features on the One Click LCA dashboard, beyond the reported
results of the study, include the completeness and plausibility checker. This goes
through material categories and individual material inputs for the project and checks
to see if they fall within a standard threshold value per square meter. This useful tool
can alert the user of values that are unusually low or high and help ensure a complete study. This can be a good initial check to see if any materials typically included
in a WBLCA have been omitted or double counted accidentally. Beyond this, the
Fig. 8.17 Graphical breakdown of global warming potential in the project. These same graphs can
be displayed for any impact category included in the study
8 Dashboard