

480
Graphs and Trees
example 5
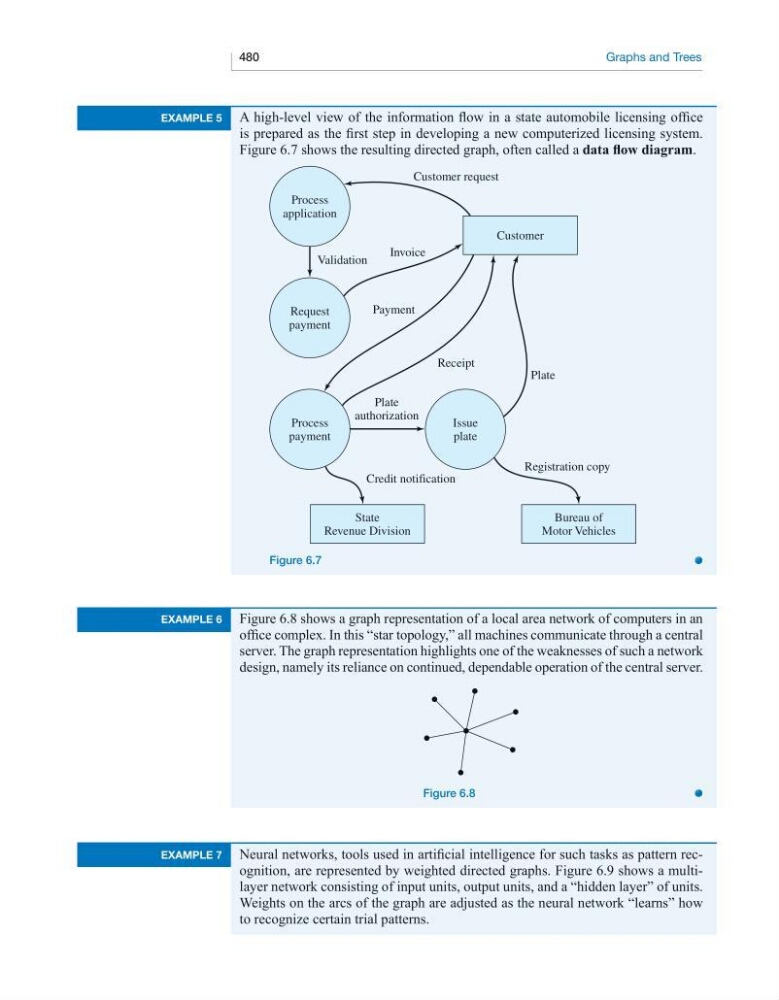
A high-level view of the information flow in a state automobile licensing office
is prepared as the first step in developing a new computerized licensing system.
Figure 6.7 shows the resulting directed graph, often called a data flow diagram.
Bureau of
Motor Vehicles
State
Revenue Division
Customer
Process
application
Request
payment
Process
payment
Issue
plate
Customer request
Invoice
Payment
Receipt
Plate
Registration copy
Plate
authorization
Credit notification
Validation
Figure 6.7
example 6
Figure 6.8 shows a graph representation of a local area network of computers in an
office complex. In this “star topology,” all machines communicate through a central
server. The graph representation highlights one of the weaknesses of such a network
design, namely its reliance on continued, dependable operation of the central server.
Figure 6.8
example 7
Neural networks, tools used in artificial intelligence for such tasks as pattern recognition, are represented by weighted directed graphs. Figure 6.9 shows a multilayer network consisting of input units, output units, and a “hidden layer” of units.
Weights on the arcs of the graph are adjusted as the neural network “learns” how
to recognize certain trial patterns.
Graphs and Trees
example 5
A high-level view of the information flow in a state automobile licensing office
is prepared as the first step in developing a new computerized licensing system.
Figure 6.7 shows the resulting directed graph, often called a data flow diagram.
Bureau of
Motor Vehicles
State
Revenue Division
Customer
Process
application
Request
payment
Process
payment
Issue
plate
Customer request
Invoice
Payment
Receipt
Plate
Registration copy
Plate
authorization
Credit notification
Validation
Figure 6.7
example 6
Figure 6.8 shows a graph representation of a local area network of computers in an
office complex. In this “star topology,” all machines communicate through a central
server. The graph representation highlights one of the weaknesses of such a network
design, namely its reliance on continued, dependable operation of the central server.
Figure 6.8
example 7
Neural networks, tools used in artificial intelligence for such tasks as pattern recognition, are represented by weighted directed graphs. Figure 6.9 shows a multilayer network consisting of input units, output units, and a “hidden layer” of units.
Weights on the arcs of the graph are adjusted as the neural network “learns” how
to recognize certain trial patterns.