

Section 6.1 Graphs and Their Representations
479
This map would be a labeled graph. We may want to use a weighted graph, where
each arc has some numerical value, or weight, associated with it. For example, we
might want to indicate the distances of the various routes in the airline map.
In this book, the term “graph” will mean an undirected graph. To refer to a
directed graph, we will always say “directed graph.”
applications of Graphs
Although the idea of a graph is very simple, an amazing number of situations
have relationships between items that lend themselves to graphical representation. Not surprisingly, there are many graphs in this book. Graphical representations of partially ordered sets (Hasse diagrams) were introduced in Chapter 5. A
PERT chart (for example, Figure 5.7) is a directed graph. The E-R diagram (for
example, Figure 5.10) is a graph. The commutative diagram illustrating composition of functions (Figure 5.23) is a directed graph. Chapter 8 will introduce logic
networks and represent them as directed graphs. Directed graphs will also be used
to describe finite-state machines in Chapter 9.
We saw that the airline route map was a graph. A representation of any network of transportation routes (a road map, for example), communications lines (as
in a computer network), or product or service distribution routes such as natural
gas pipelines or water mains is a graph. The chemical structure of a molecule is
represented graphically.
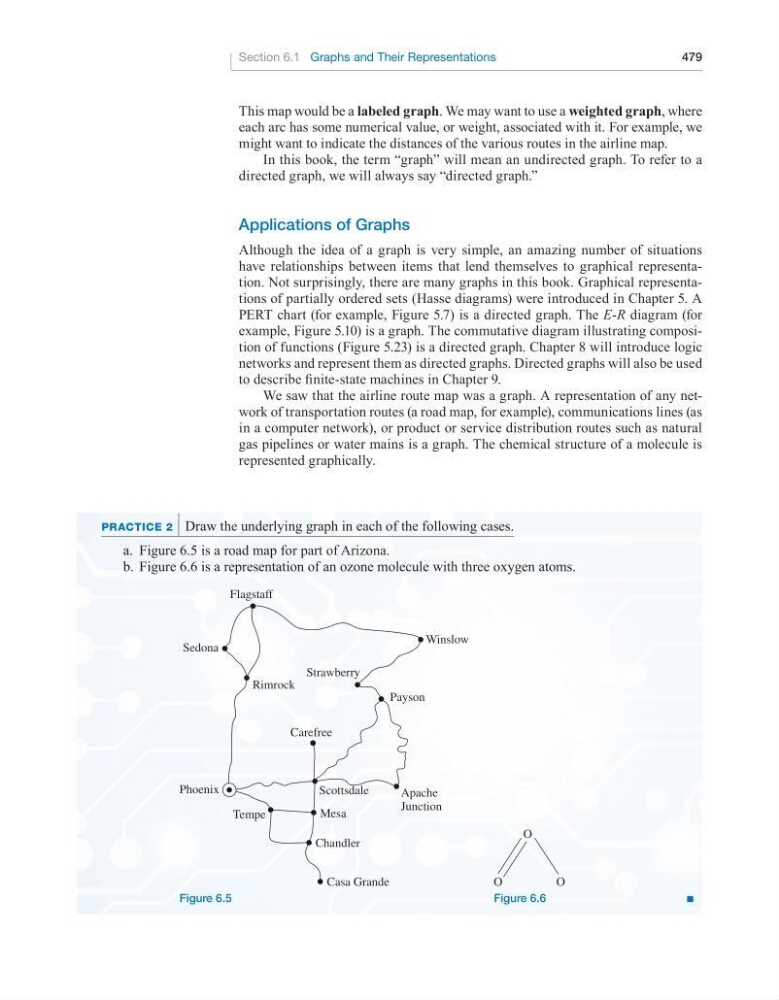
praCTiCe 2 Draw the underlying graph in each of the following cases.
a. Figure 6.5 is a road map for part of Arizona.
b. Figure 6.6 is a representation of an ozone molecule with three oxygen atoms.
O
O
O
Figure 6.6
Winslow
Flagstaff
Strawberry
Carefree
Payson
Apache
Junction
Sedona
Phoenix
Tempe
Casa Grande
Chandler
Mesa
Scottsdale
Rimrock
Figure 6.5
■
479
This map would be a labeled graph. We may want to use a weighted graph, where
each arc has some numerical value, or weight, associated with it. For example, we
might want to indicate the distances of the various routes in the airline map.
In this book, the term “graph” will mean an undirected graph. To refer to a
directed graph, we will always say “directed graph.”
applications of Graphs
Although the idea of a graph is very simple, an amazing number of situations
have relationships between items that lend themselves to graphical representation. Not surprisingly, there are many graphs in this book. Graphical representations of partially ordered sets (Hasse diagrams) were introduced in Chapter 5. A
PERT chart (for example, Figure 5.7) is a directed graph. The E-R diagram (for
example, Figure 5.10) is a graph. The commutative diagram illustrating composition of functions (Figure 5.23) is a directed graph. Chapter 8 will introduce logic
networks and represent them as directed graphs. Directed graphs will also be used
to describe finite-state machines in Chapter 9.
We saw that the airline route map was a graph. A representation of any network of transportation routes (a road map, for example), communications lines (as
in a computer network), or product or service distribution routes such as natural
gas pipelines or water mains is a graph. The chemical structure of a molecule is
represented graphically.
praCTiCe 2 Draw the underlying graph in each of the following cases.
a. Figure 6.5 is a road map for part of Arizona.
b. Figure 6.6 is a representation of an ozone molecule with three oxygen atoms.
O
O
O
Figure 6.6
Winslow
Flagstaff
Strawberry
Carefree
Payson
Apache
Junction
Sedona
Phoenix
Tempe
Casa Grande
Chandler
Mesa
Scottsdale
Rimrock
Figure 6.5
■