

40
G. Benckiser
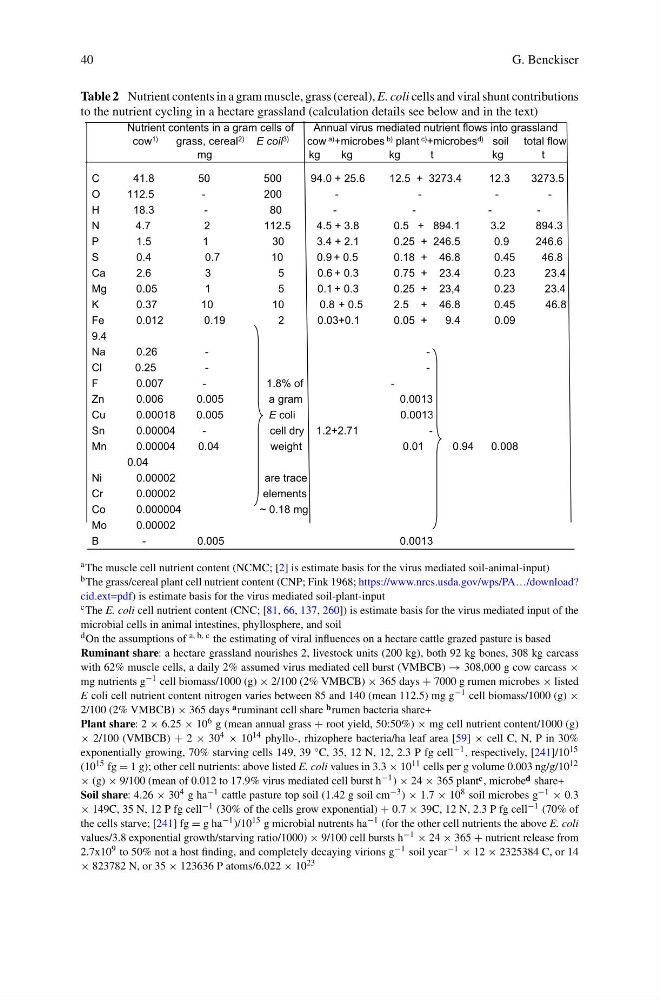
Table 2 Nutrient contents in a gram muscle, grass (cereal), E. coli cells and viral shunt contributions
to the nutrient cycling in a hectare grassland (calculation details see below and in the text)
Nutrient contents in a gram cells of
Annual virus mediated nutrient flows into grassland
cow 1)
grass, cereal 2) E coil 3)
cow a) +microbes b) plant c) +microbes d) soil total flow
mg
kg
kg
kg
t
kg
t
C
41.8
50
500
94.0 + 25.6
12.5 + 3273.4
12.3
3273.5
O
112.5
-
200
-
-
-
-
H
18.3
-
80
-
-
-
-
N
4.7
2
112.5
4.5 + 3.8
0.5 + 894.1
3.2
894.3
P
1.5
1
30
3.4 + 2.1
0.25 + 246.5
0.9
246.6
S
0.4
0.7
10
0.9 + 0.5
0.18 + 46.8
0.45
46.8
Ca
2.6
3
5
0.6 + 0.3
0.75 + 23.4
0.23
23.4
Mg
0.05
1
5
0.1 + 0.3
0.25 + 23,4
0.23
23.4
K
0.37
10
10
0.8 + 0.5
2.5 + 46.8
0.45
46.8
Fe
0.012
0.19
2
0.03+0.1
0.05 +
9.4
0.09
9.4
Na
0.26
-
-
Cl
0.25
-
-
F
0.007
-
1.8% of
-
Zn
0.006
0.005
a gram
0.0013
Cu
0.00018
0.005
E coli
0.0013
Sn
0.00004
-
cell dry 1.2+2.71
-
Mn
0.00004
0.04
weight
0.01
0.94
0.008
0.04
Ni
0.00002
are trace
Cr
0.00002
elements
Co
0.000004
~ 0.18 mg
Mo
0.00002
B
-
0.005
0.0013
a The muscle cell nutrient content (NCMC; [2] is estimate basis for the virus mediated soil-animal-input)
b The grass/cereal plant cell nutrient content (CNP; Fink 1968; https://www.nrcs.usda.gov/wps/PA…/download?
cid.ext=pdf) is estimate basis for the virus mediated soil-plant-input
c The E. coli cell nutrient content (CNC; [81, 66, 137, 260]) is estimate basis for the virus mediated input of the
microbial cells in animal intestines, phyllosphere, and soil
d On the assumptions of a, b, c the estimating of viral influences on a hectare cattle grazed pasture is based
Ruminant share: a hectare grassland nourishes 2, livestock units (200 kg), both 92 kg bones, 308 kg carcass
with 62% muscle cells, a daily 2% assumed virus mediated cell burst (VMBCB) → 308,000 g cow carcass ×
mg nutrients g −1 cell biomass/1000 (g) × 2/100 (2% VMBCB) × 365 days + 7000 g rumen microbes × listed
E coli cell nutrient content nitrogen varies between 85 and 140 (mean 112.5) mg g −1 cell biomass/1000 (g) ×
2/100 (2% VMBCB) × 365 days a ruminant cell share b rumen bacteria share+
Plant share: 2 × 6.25 × 10 6 g (mean annual grass + root yield, 50:50%) × mg cell nutrient content/1000 (g)
× 2/100 (VMBCB) + 2 × 30 4 × 10 14 phyllo-, rhizophere bacteria/ha leaf area [59] × cell C, N, P in 30%
exponentially growing, 70% starving cells 149, 39 °C, 35, 12 N, 12, 2.3 P fg cell −1 , respectively, [241]/10 15
(10 15 fg = 1 g); other cell nutrients: above listed E. coli values in 3.3 × 10 11 cells per g volume 0.003 ng/g/10 12
× (g) × 9/100 (mean of 0.012 to 17.9% virus mediated cell burst h −1 ) × 24 × 365 plant c , microbe d share+
Soil share: 4.26 × 30 4 g ha −1 cattle pasture top soil (1.42 g soil cm −3 ) × 1.7 × 10 8 soil microbes g −1 × 0.3
× 149C, 35 N, 12 P fg cell −1 (30% of the cells grow exponential) + 0.7 × 39C, 12 N, 2.3 P fg cell −1 (70% of
the cells starve; [241] fg = g ha −1 )/10 15 g microbial nutrents ha −1 (for the other cell nutrients the above E. coli
values/3.8 exponential growth/starving ratio/1000) × 9/100 cell bursts h −1 × 24 × 365 + nutrient release from
2.7x10 9 to 50% not a host finding, and completely decaying virions g −1 soil year −1 × 12 × 2325384 C, or 14
× 823782 N, or 35 × 123636 P atoms/6.022 × 10 23
G. Benckiser
Table 2 Nutrient contents in a gram muscle, grass (cereal), E. coli cells and viral shunt contributions
to the nutrient cycling in a hectare grassland (calculation details see below and in the text)
Nutrient contents in a gram cells of
Annual virus mediated nutrient flows into grassland
cow 1)
grass, cereal 2) E coil 3)
cow a) +microbes b) plant c) +microbes d) soil total flow
mg
kg
kg
kg
t
kg
t
C
41.8
50
500
94.0 + 25.6
12.5 + 3273.4
12.3
3273.5
O
112.5
-
200
-
-
-
-
H
18.3
-
80
-
-
-
-
N
4.7
2
112.5
4.5 + 3.8
0.5 + 894.1
3.2
894.3
P
1.5
1
30
3.4 + 2.1
0.25 + 246.5
0.9
246.6
S
0.4
0.7
10
0.9 + 0.5
0.18 + 46.8
0.45
46.8
Ca
2.6
3
5
0.6 + 0.3
0.75 + 23.4
0.23
23.4
Mg
0.05
1
5
0.1 + 0.3
0.25 + 23,4
0.23
23.4
K
0.37
10
10
0.8 + 0.5
2.5 + 46.8
0.45
46.8
Fe
0.012
0.19
2
0.03+0.1
0.05 +
9.4
0.09
9.4
Na
0.26
-
-
Cl
0.25
-
-
F
0.007
-
1.8% of
-
Zn
0.006
0.005
a gram
0.0013
Cu
0.00018
0.005
E coli
0.0013
Sn
0.00004
-
cell dry 1.2+2.71
-
Mn
0.00004
0.04
weight
0.01
0.94
0.008
0.04
Ni
0.00002
are trace
Cr
0.00002
elements
Co
0.000004
~ 0.18 mg
Mo
0.00002
B
-
0.005
0.0013
a The muscle cell nutrient content (NCMC; [2] is estimate basis for the virus mediated soil-animal-input)
b The grass/cereal plant cell nutrient content (CNP; Fink 1968; https://www.nrcs.usda.gov/wps/PA…/download?
cid.ext=pdf) is estimate basis for the virus mediated soil-plant-input
c The E. coli cell nutrient content (CNC; [81, 66, 137, 260]) is estimate basis for the virus mediated input of the
microbial cells in animal intestines, phyllosphere, and soil
d On the assumptions of a, b, c the estimating of viral influences on a hectare cattle grazed pasture is based
Ruminant share: a hectare grassland nourishes 2, livestock units (200 kg), both 92 kg bones, 308 kg carcass
with 62% muscle cells, a daily 2% assumed virus mediated cell burst (VMBCB) → 308,000 g cow carcass ×
mg nutrients g −1 cell biomass/1000 (g) × 2/100 (2% VMBCB) × 365 days + 7000 g rumen microbes × listed
E coli cell nutrient content nitrogen varies between 85 and 140 (mean 112.5) mg g −1 cell biomass/1000 (g) ×
2/100 (2% VMBCB) × 365 days a ruminant cell share b rumen bacteria share+
Plant share: 2 × 6.25 × 10 6 g (mean annual grass + root yield, 50:50%) × mg cell nutrient content/1000 (g)
× 2/100 (VMBCB) + 2 × 30 4 × 10 14 phyllo-, rhizophere bacteria/ha leaf area [59] × cell C, N, P in 30%
exponentially growing, 70% starving cells 149, 39 °C, 35, 12 N, 12, 2.3 P fg cell −1 , respectively, [241]/10 15
(10 15 fg = 1 g); other cell nutrients: above listed E. coli values in 3.3 × 10 11 cells per g volume 0.003 ng/g/10 12
× (g) × 9/100 (mean of 0.012 to 17.9% virus mediated cell burst h −1 ) × 24 × 365 plant c , microbe d share+
Soil share: 4.26 × 30 4 g ha −1 cattle pasture top soil (1.42 g soil cm −3 ) × 1.7 × 10 8 soil microbes g −1 × 0.3
× 149C, 35 N, 12 P fg cell −1 (30% of the cells grow exponential) + 0.7 × 39C, 12 N, 2.3 P fg cell −1 (70% of
the cells starve; [241] fg = g ha −1 )/10 15 g microbial nutrents ha −1 (for the other cell nutrients the above E. coli
values/3.8 exponential growth/starving ratio/1000) × 9/100 cell bursts h −1 × 24 × 365 + nutrient release from
2.7x10 9 to 50% not a host finding, and completely decaying virions g −1 soil year −1 × 12 × 2325384 C, or 14
× 823782 N, or 35 × 123636 P atoms/6.022 × 10 23