

Recent Advances in Understanding the Role of Wastewater …
15
gas from the chloramines will occur once the free chlorine is liberated i.e., the total
reaction is written below:
NH 4 + HOCl → N 2 + H 2 O + H
+
+ Cl
−
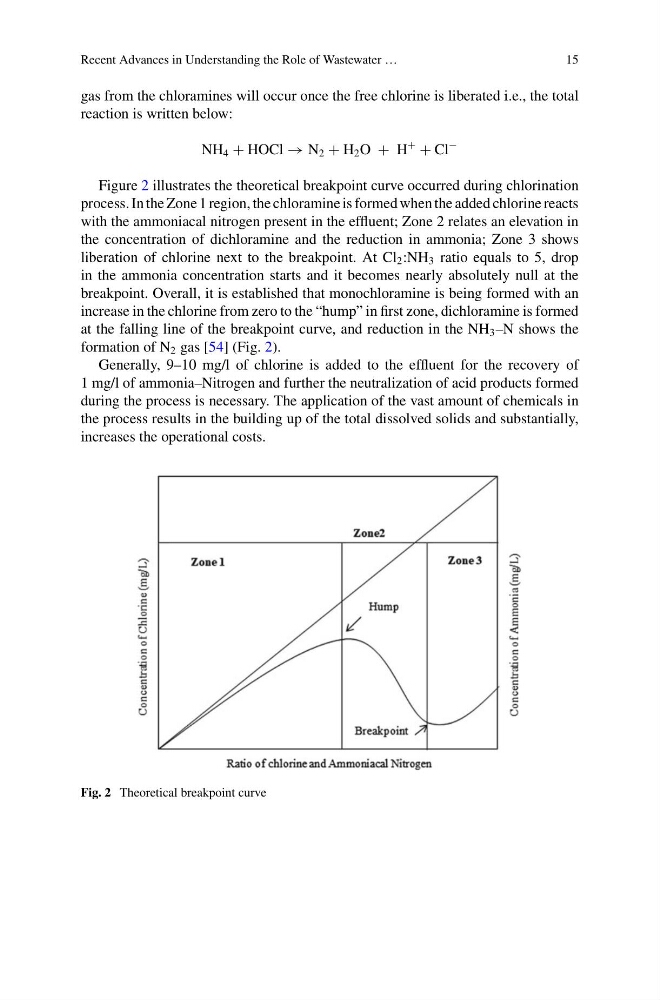
Figure 2 illustrates the theoretical breakpoint curve occurred during chlorination
process. In the Zone 1 region, the chloramine is formed when the added chlorine reacts
with the ammoniacal nitrogen present in the effluent; Zone 2 relates an elevation in
the concentration of dichloramine and the reduction in ammonia; Zone 3 shows
liberation of chlorine next to the breakpoint. At Cl 2 :NH 3 ratio equals to 5, drop
in the ammonia concentration starts and it becomes nearly absolutely null at the
breakpoint. Overall, it is established that monochloramine is being formed with an
increase in the chlorine from zero to the “hump” in first zone, dichloramine is formed
at the falling line of the breakpoint curve, and reduction in the NH 3 –N shows the
formation of N 2 gas [54] (Fig. 2).
Generally, 9–10 mg/l of chlorine is added to the effluent for the recovery of
1 mg/l of ammonia–Nitrogen and further the neutralization of acid products formed
during the process is necessary. The application of the vast amount of chemicals in
the process results in the building up of the total dissolved solids and substantially,
increases the operational costs.
Fig. 2 Theoretical breakpoint curve
15
gas from the chloramines will occur once the free chlorine is liberated i.e., the total
reaction is written below:
NH 4 + HOCl → N 2 + H 2 O + H
+
+ Cl
−
Figure 2 illustrates the theoretical breakpoint curve occurred during chlorination
process. In the Zone 1 region, the chloramine is formed when the added chlorine reacts
with the ammoniacal nitrogen present in the effluent; Zone 2 relates an elevation in
the concentration of dichloramine and the reduction in ammonia; Zone 3 shows
liberation of chlorine next to the breakpoint. At Cl 2 :NH 3 ratio equals to 5, drop
in the ammonia concentration starts and it becomes nearly absolutely null at the
breakpoint. Overall, it is established that monochloramine is being formed with an
increase in the chlorine from zero to the “hump” in first zone, dichloramine is formed
at the falling line of the breakpoint curve, and reduction in the NH 3 –N shows the
formation of N 2 gas [54] (Fig. 2).
Generally, 9–10 mg/l of chlorine is added to the effluent for the recovery of
1 mg/l of ammonia–Nitrogen and further the neutralization of acid products formed
during the process is necessary. The application of the vast amount of chemicals in
the process results in the building up of the total dissolved solids and substantially,
increases the operational costs.
Fig. 2 Theoretical breakpoint curve