

90
E. Vavoulidou et al.
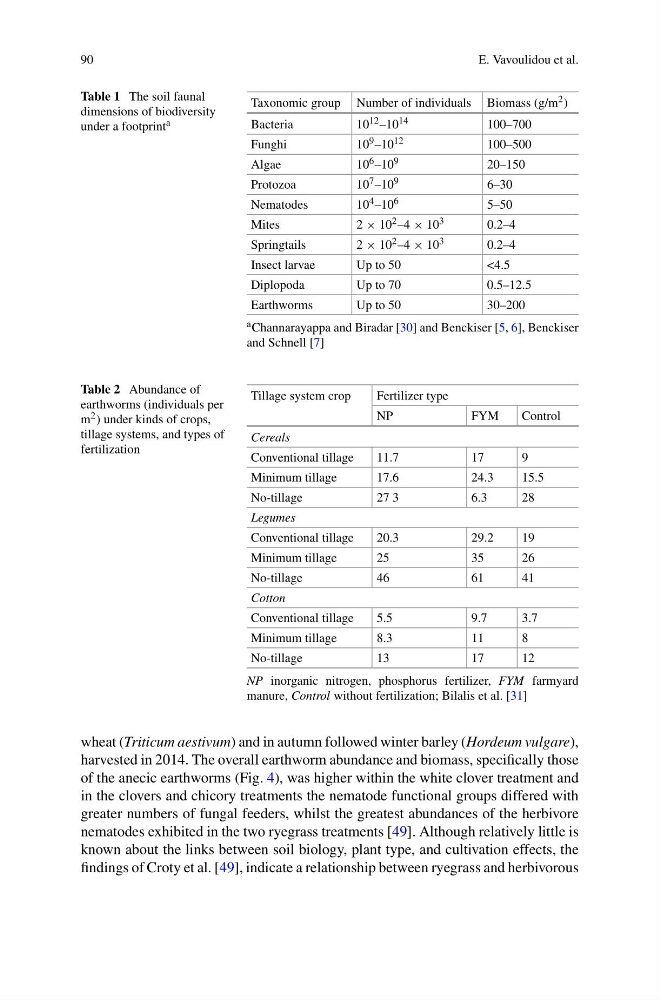
Table 1 The soil faunal
dimensions of biodiversity
under a footprint a
Taxonomic group Number of individuals Biomass (g/m 2 )
Bacteria
10 12 –10 14
100–700
Funghi
10 9 –10 12
100–500
Algae
10 6 –10 9
20–150
Protozoa
10 7 –10 9
6–30
Nematodes
10 4 –10 6
5–50
Mites
2 × 10 2 –4 × 10 3
0.2–4
Springtails
2 × 10 2 –4 × 10 3
0.2–4
Insect larvae
Up to 50
<4.5
Diplopoda
Up to 70
0.5–12.5
Earthworms
Up to 50
30–200
a Channarayappa and Biradar [30] and Benckiser [5, 6], Benckiser
and Schnell [7]
Table 2 Abundance of
earthworms (individuals per
m 2 ) under kinds of crops,
tillage systems, and types of
fertilization
Tillage system crop
Fertilizer type
NP
FYM
Control
Cereals
Conventional tillage
11.7
17
9
Minimum tillage
17.6
24.3
15.5
No-tillage
27 3
6.3
28
Legumes
Conventional tillage
20.3
29.2
19
Minimum tillage
25
35
26
No-tillage
46
61
41
Cotton
Conventional tillage
5.5
9.7
3.7
Minimum tillage
8.3
11
8
No-tillage
13
17
12
NP inorganic nitrogen, phosphorus fertilizer, FYM farmyard
manure, Control without fertilization; Bilalis et al. [31]
wheat (Triticum aestivum) and in autumn followed winter barley (Hordeum vulgare),
harvested in 2014. The overall earthworm abundance and biomass, specifically those
of the anecic earthworms (Fig. 4), was higher within the white clover treatment and
in the clovers and chicory treatments the nematode functional groups differed with
greater numbers of fungal feeders, whilst the greatest abundances of the herbivore
nematodes exhibited in the two ryegrass treatments [49]. Although relatively little is
known about the links between soil biology, plant type, and cultivation effects, the
findings of Croty et al. [49], indicate a relationship between ryegrass and herbivorous
E. Vavoulidou et al.
Table 1 The soil faunal
dimensions of biodiversity
under a footprint a
Taxonomic group Number of individuals Biomass (g/m 2 )
Bacteria
10 12 –10 14
100–700
Funghi
10 9 –10 12
100–500
Algae
10 6 –10 9
20–150
Protozoa
10 7 –10 9
6–30
Nematodes
10 4 –10 6
5–50
Mites
2 × 10 2 –4 × 10 3
0.2–4
Springtails
2 × 10 2 –4 × 10 3
0.2–4
Insect larvae
Up to 50
<4.5
Diplopoda
Up to 70
0.5–12.5
Earthworms
Up to 50
30–200
a Channarayappa and Biradar [30] and Benckiser [5, 6], Benckiser
and Schnell [7]
Table 2 Abundance of
earthworms (individuals per
m 2 ) under kinds of crops,
tillage systems, and types of
fertilization
Tillage system crop
Fertilizer type
NP
FYM
Control
Cereals
Conventional tillage
11.7
17
9
Minimum tillage
17.6
24.3
15.5
No-tillage
27 3
6.3
28
Legumes
Conventional tillage
20.3
29.2
19
Minimum tillage
25
35
26
No-tillage
46
61
41
Cotton
Conventional tillage
5.5
9.7
3.7
Minimum tillage
8.3
11
8
No-tillage
13
17
12
NP inorganic nitrogen, phosphorus fertilizer, FYM farmyard
manure, Control without fertilization; Bilalis et al. [31]
wheat (Triticum aestivum) and in autumn followed winter barley (Hordeum vulgare),
harvested in 2014. The overall earthworm abundance and biomass, specifically those
of the anecic earthworms (Fig. 4), was higher within the white clover treatment and
in the clovers and chicory treatments the nematode functional groups differed with
greater numbers of fungal feeders, whilst the greatest abundances of the herbivore
nematodes exhibited in the two ryegrass treatments [49]. Although relatively little is
known about the links between soil biology, plant type, and cultivation effects, the
findings of Croty et al. [49], indicate a relationship between ryegrass and herbivorous