

26
Internet of Things (IoT)
The rough error described above is based on the distances between patterns. However,
we know the categorization of the patterns based on activity and the person performing
the activity. In this experiment, we will focus on the categorization of the data based on
the person. We first need to make a correspondence between a cluster and the most predominant class in the upper bound of that cluster. We then count the number of correctly
classified patterns. The error in classification will be the number of incorrectly classified
patterns, wrongClasses. We then take a weighted combination of ∆ rough and wrongClasses:
objective w
w wrongClasses
d
r ough
c
=
×∆
+
×
,
(2.8)
where w d is the weight attached to the rough error and w c is the weight attached to the
classification error. Our GAs will minimize the objective functions given by Equation 2.8.
2.5 Study Data
The Muse headband is a commercially available wearable product for consumer use.
The usage of a commercial product in this study leaves the decisions for sensor selection
and positioning to the device manufacturer. The Muse headband uses four sensors, two
located on the forehead, and two behind the ears. Three additional sensors on the forehead
are used as reference sensors by the device. Although the Muse API also provides access
to the signals for muscle movement and accelerometer data, our research focused on the
EEG data. Muse provides this data in a variety of formats. At the lowest level, the analog
microvolt signals are recorded by the four sensors which, by default, are sampled at a rate of
220 Hz. These EEG signals are then compressed in order to stream the data over Bluetooth.
The signals are compressed via Golomb Encoding and further quantized to reduce their
size. Full details on Muse’s compression algorithm are available via their online manual
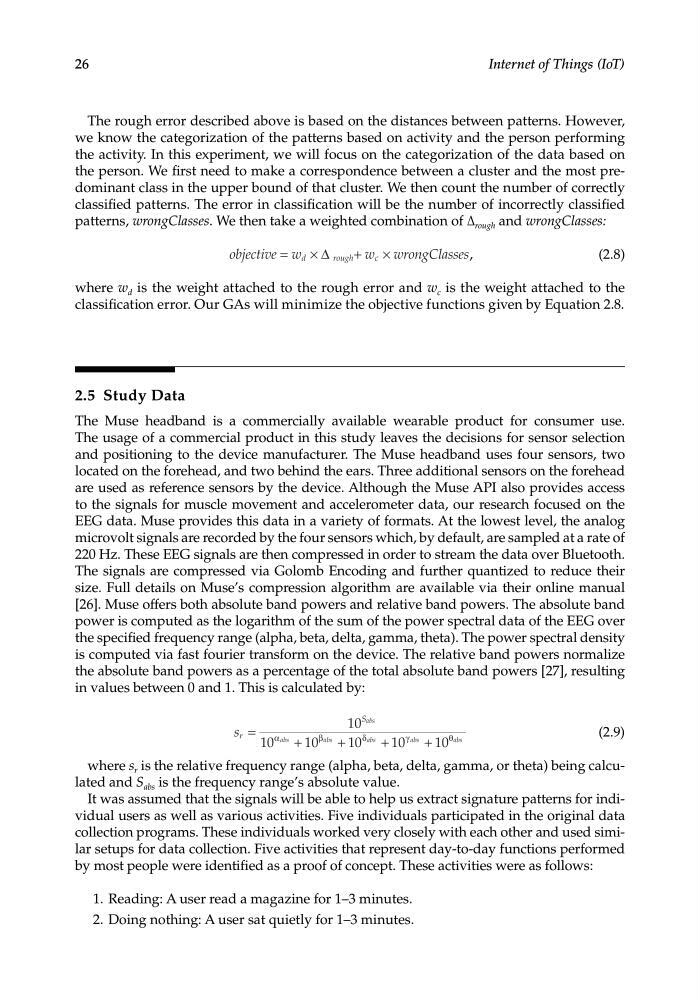
[26]. Muse offers both absolute band powers and relative band powers. The absolute band
power is computed as the logarithm of the sum of the power spectral data of the EEG over
the specified frequency range (alpha, beta, delta, gamma, theta). The power spectral density
is computed via fast fourier transform on the device. The relative band powers normalize
the absolute band powers as a percentage of the total absolute band powers [27], resulting
in values between 0 and 1. This is calculated by:
s r
Sabs
abs
a bs
abs
a bs
abs
=
+
+
+
+
α
β
δ
γ
θ
10
10
10
10
10
10
(2.9)
where s r is the relative frequency range (alpha, beta, delta, gamma, or theta) being calculated and S abs is the frequency range’s absolute value.
It was assumed that the signals will be able to help us extract signature patterns for individual users as well as various activities. Five individuals participated in the original data
collection programs. These individuals worked very closely with each other and used similar setups for data collection. Five activities that represent day-to-day functions performed
by most people were identified as a proof of concept. These activities were as follows:
1. Reading: A user read a magazine for 1–3 minutes.
2. Doing nothing: A user sat quietly for 1–3 minutes.
Internet of Things (IoT)
The rough error described above is based on the distances between patterns. However,
we know the categorization of the patterns based on activity and the person performing
the activity. In this experiment, we will focus on the categorization of the data based on
the person. We first need to make a correspondence between a cluster and the most predominant class in the upper bound of that cluster. We then count the number of correctly
classified patterns. The error in classification will be the number of incorrectly classified
patterns, wrongClasses. We then take a weighted combination of ∆ rough and wrongClasses:
objective w
w wrongClasses
d
r ough
c
=
×∆
+
×
,
(2.8)
where w d is the weight attached to the rough error and w c is the weight attached to the
classification error. Our GAs will minimize the objective functions given by Equation 2.8.
2.5 Study Data
The Muse headband is a commercially available wearable product for consumer use.
The usage of a commercial product in this study leaves the decisions for sensor selection
and positioning to the device manufacturer. The Muse headband uses four sensors, two
located on the forehead, and two behind the ears. Three additional sensors on the forehead
are used as reference sensors by the device. Although the Muse API also provides access
to the signals for muscle movement and accelerometer data, our research focused on the
EEG data. Muse provides this data in a variety of formats. At the lowest level, the analog
microvolt signals are recorded by the four sensors which, by default, are sampled at a rate of
220 Hz. These EEG signals are then compressed in order to stream the data over Bluetooth.
The signals are compressed via Golomb Encoding and further quantized to reduce their
size. Full details on Muse’s compression algorithm are available via their online manual
[26]. Muse offers both absolute band powers and relative band powers. The absolute band
power is computed as the logarithm of the sum of the power spectral data of the EEG over
the specified frequency range (alpha, beta, delta, gamma, theta). The power spectral density
is computed via fast fourier transform on the device. The relative band powers normalize
the absolute band powers as a percentage of the total absolute band powers [27], resulting
in values between 0 and 1. This is calculated by:
s r
Sabs
abs
a bs
abs
a bs
abs
=
+
+
+
+
α
β
δ
γ
θ
10
10
10
10
10
10
(2.9)
where s r is the relative frequency range (alpha, beta, delta, gamma, or theta) being calculated and S abs is the frequency range’s absolute value.
It was assumed that the signals will be able to help us extract signature patterns for individual users as well as various activities. Five individuals participated in the original data
collection programs. These individuals worked very closely with each other and used similar setups for data collection. Five activities that represent day-to-day functions performed
by most people were identified as a proof of concept. These activities were as follows:
1. Reading: A user read a magazine for 1–3 minutes.
2. Doing nothing: A user sat quietly for 1–3 minutes.