

68
D. Kocáb et al.
Core samples (further on also CS) from reinforced road bridge abutments were
used for the frost resistance test. Due to the conditions imposed by the bridge manager,
it was not possible to extract a CS with a diameter of over 100 mm. It was therefore
clear that the concrete frost resistance will not be determined using standard prism
specimens of 100 × 100 × 400 mm. CS with a nominal diameter of 100 mm were
taken from both abutments and test cylinders with a nominal diameter of 100 mm and
a nominal length of 150 mm were made from them. These test specimens were used
to determine the frost resistance. We also prepared test specimens with a nominal
diameter of 100 mm and a nominal length of 100 mm for testing compressive strength
and specimens with a nominal diameter of 100 mm and a nominal length of 200 mm
for testing direct tensile strength.
To determine the frost resistance, the original plan was to use 9 test cylinders, 3 of
which were supposed to be reference specimens and 6 were going to be exposed to
the burden of F-T cycles. Three of the burdened specimens were going to be used for
a destructive method of frost resistance determination after running 25 F-T cycles and
the remaining three were meant to be used for a destructive method of frost resistance
determination after 50 F-T cycles. However, it turned out that a test planned in this
way could not be done with a relevant result since each of the abutments was very
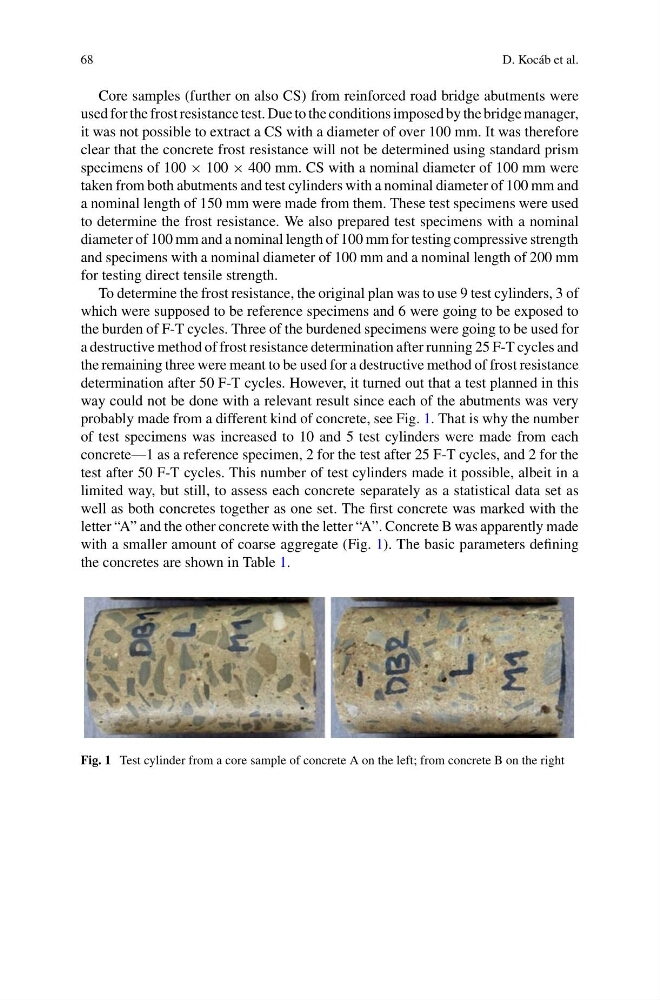
probably made from a different kind of concrete, see Fig. 1. That is why the number
of test specimens was increased to 10 and 5 test cylinders were made from each
concrete—1 as a reference specimen, 2 for the test after 25 F-T cycles, and 2 for the
test after 50 F-T cycles. This number of test cylinders made it possible, albeit in a
limited way, but still, to assess each concrete separately as a statistical data set as
well as both concretes together as one set. The first concrete was marked with the
letter “A” and the other concrete with the letter “A”. Concrete B was apparently made
with a smaller amount of coarse aggregate (Fig. 1). The basic parameters defining
the concretes are shown in Table 1.
Fig. 1 Test cylinder from a core sample of concrete A on the left; from concrete B on the right
D. Kocáb et al.
Core samples (further on also CS) from reinforced road bridge abutments were
used for the frost resistance test. Due to the conditions imposed by the bridge manager,
it was not possible to extract a CS with a diameter of over 100 mm. It was therefore
clear that the concrete frost resistance will not be determined using standard prism
specimens of 100 × 100 × 400 mm. CS with a nominal diameter of 100 mm were
taken from both abutments and test cylinders with a nominal diameter of 100 mm and
a nominal length of 150 mm were made from them. These test specimens were used
to determine the frost resistance. We also prepared test specimens with a nominal
diameter of 100 mm and a nominal length of 100 mm for testing compressive strength
and specimens with a nominal diameter of 100 mm and a nominal length of 200 mm
for testing direct tensile strength.
To determine the frost resistance, the original plan was to use 9 test cylinders, 3 of
which were supposed to be reference specimens and 6 were going to be exposed to
the burden of F-T cycles. Three of the burdened specimens were going to be used for
a destructive method of frost resistance determination after running 25 F-T cycles and
the remaining three were meant to be used for a destructive method of frost resistance
determination after 50 F-T cycles. However, it turned out that a test planned in this
way could not be done with a relevant result since each of the abutments was very
probably made from a different kind of concrete, see Fig. 1. That is why the number
of test specimens was increased to 10 and 5 test cylinders were made from each
concrete—1 as a reference specimen, 2 for the test after 25 F-T cycles, and 2 for the
test after 50 F-T cycles. This number of test cylinders made it possible, albeit in a
limited way, but still, to assess each concrete separately as a statistical data set as
well as both concretes together as one set. The first concrete was marked with the
letter “A” and the other concrete with the letter “A”. Concrete B was apparently made
with a smaller amount of coarse aggregate (Fig. 1). The basic parameters defining
the concretes are shown in Table 1.
Fig. 1 Test cylinder from a core sample of concrete A on the left; from concrete B on the right