

Influence of Major Beam Damage on the Redistribution …
37
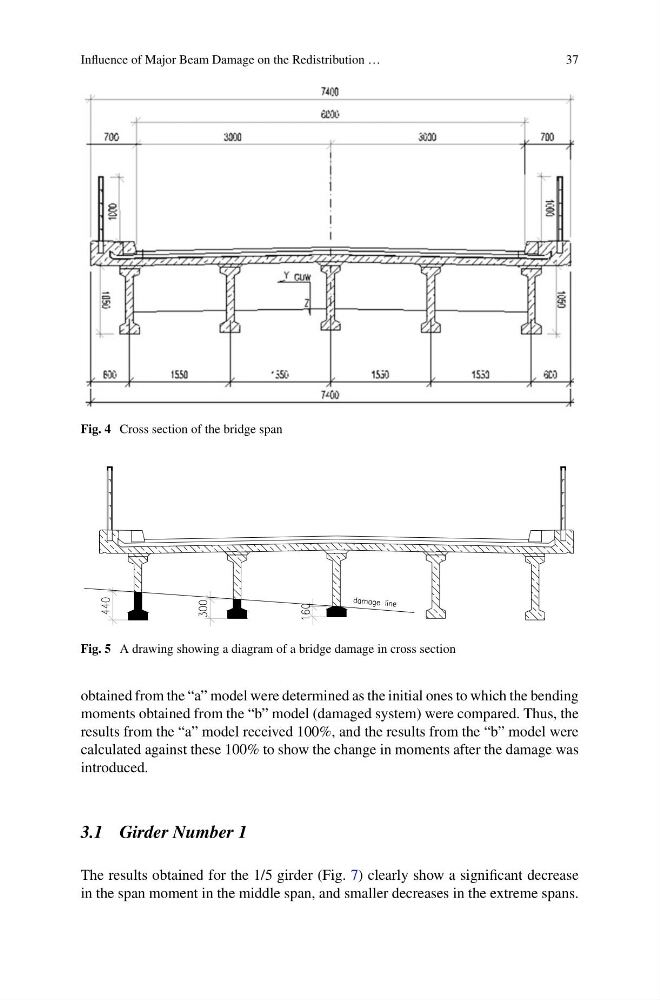
Fig. 4 Cross section of the bridge span
Fig. 5 A drawing showing a diagram of a bridge damage in cross section
obtained from the “a” model were determined as the initial ones to which the bending
moments obtained from the “b” model (damaged system) were compared. Thus, the
results from the “a” model received 100%, and the results from the “b” model were
calculated against these 100% to show the change in moments after the damage was
introduced.
3.1 Girder Number 1
The results obtained for the 1/5 girder (Fig. 7) clearly show a significant decrease
in the span moment in the middle span, and smaller decreases in the extreme spans.
37
Fig. 4 Cross section of the bridge span
Fig. 5 A drawing showing a diagram of a bridge damage in cross section
obtained from the “a” model were determined as the initial ones to which the bending
moments obtained from the “b” model (damaged system) were compared. Thus, the
results from the “a” model received 100%, and the results from the “b” model were
calculated against these 100% to show the change in moments after the damage was
introduced.
3.1 Girder Number 1
The results obtained for the 1/5 girder (Fig. 7) clearly show a significant decrease
in the span moment in the middle span, and smaller decreases in the extreme spans.