

36
K. Jurasz-Drozdowska and W. Radomski
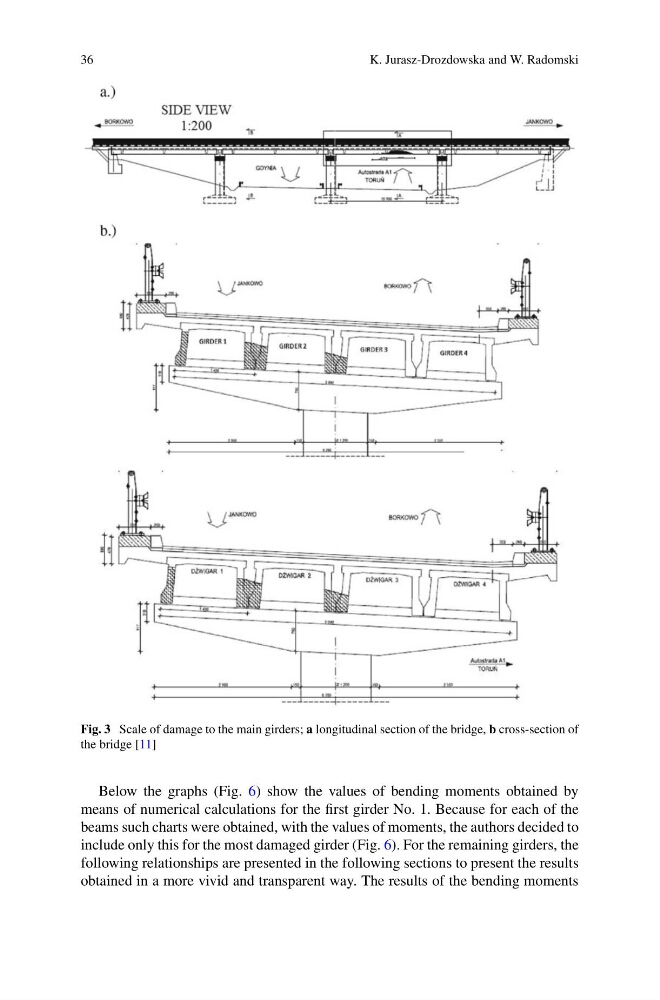
Fig. 3 Scale of damage to the main girders; a longitudinal section of the bridge, b cross-section of
the bridge [11]
Below the graphs (Fig. 6) show the values of bending moments obtained by
means of numerical calculations for the first girder No. 1. Because for each of the
beams such charts were obtained, with the values of moments, the authors decided to
include only this for the most damaged girder (Fig. 6). For the remaining girders, the
following relationships are presented in the following sections to present the results
obtained in a more vivid and transparent way. The results of the bending moments
K. Jurasz-Drozdowska and W. Radomski
Fig. 3 Scale of damage to the main girders; a longitudinal section of the bridge, b cross-section of
the bridge [11]
Below the graphs (Fig. 6) show the values of bending moments obtained by
means of numerical calculations for the first girder No. 1. Because for each of the
beams such charts were obtained, with the values of moments, the authors decided to
include only this for the most damaged girder (Fig. 6). For the remaining girders, the
following relationships are presented in the following sections to present the results
obtained in a more vivid and transparent way. The results of the bending moments