

The Influence of Grinding Method on the Particle Size …
149
Table 5 Results of rheological testing
Sample
Testing after time
Rheological parameters
Surface area of
hysteresis loop (Pa/s)
Yield stress (Pa)
plastic viscosity
(Pa:s)
CI
10
44.6
0.21
158
30
52.2
0.23
570
60
65.2
0.29
640
CIG
10
66.2
0.37
880
30
75.5
0.40
–
60
98.2
0.52
2100
CI + 30%V
10
33.8
0.28
31
30
43.4
0.34
3300
60
54.4
0.38
3740
CI + 30%VG
10
57.0
0.35
–
30
78.5
0.51
5890
60
95.4
0.62
6590
CI + 30%S
10
25.4
0.13
–
30
33.1
0.22
855
60
42.3
0.28
690
CI + 30%SG
10
27.9
0.15
–
30
37.1
0.27
1870
60
39.0
0.37
3986
Table 6 Results of mortars
consistency testing,
compressive and flexural
strength testing
Sample
Consistency
(cm)
Strength
Flexural
(MPa)
Compressive
(MPa)
CI
4.0
6.54
45.4
CIG
5.0
7.15
55.2
CI + 30%V
6.5
5.87
32.6
CI + 30%VG
6.5
5.55
35.2
CI + 30%S
3.5
4.86
25.1
CI + 30%SG
3.0
4.66
26.5
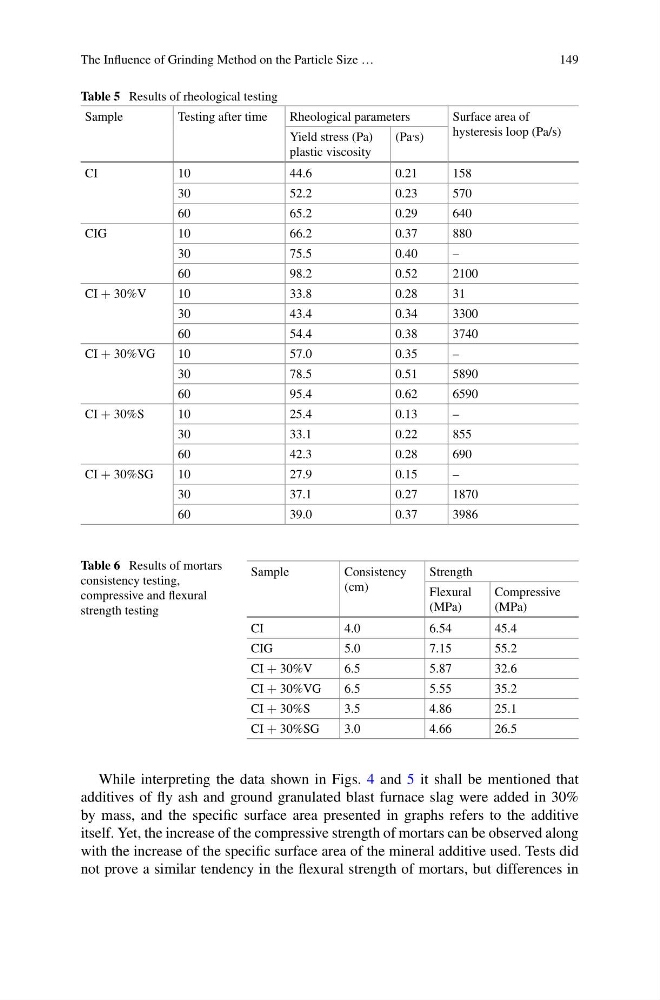
While interpreting the data shown in Figs. 4 and 5 it shall be mentioned that
additives of fly ash and ground granulated blast furnace slag were added in 30%
by mass, and the specific surface area presented in graphs refers to the additive
itself. Yet, the increase of the compressive strength of mortars can be observed along
with the increase of the specific surface area of the mineral additive used. Tests did
not prove a similar tendency in the flexural strength of mortars, but differences in
149
Table 5 Results of rheological testing
Sample
Testing after time
Rheological parameters
Surface area of
hysteresis loop (Pa/s)
Yield stress (Pa)
plastic viscosity
(Pa:s)
CI
10
44.6
0.21
158
30
52.2
0.23
570
60
65.2
0.29
640
CIG
10
66.2
0.37
880
30
75.5
0.40
–
60
98.2
0.52
2100
CI + 30%V
10
33.8
0.28
31
30
43.4
0.34
3300
60
54.4
0.38
3740
CI + 30%VG
10
57.0
0.35
–
30
78.5
0.51
5890
60
95.4
0.62
6590
CI + 30%S
10
25.4
0.13
–
30
33.1
0.22
855
60
42.3
0.28
690
CI + 30%SG
10
27.9
0.15
–
30
37.1
0.27
1870
60
39.0
0.37
3986
Table 6 Results of mortars
consistency testing,
compressive and flexural
strength testing
Sample
Consistency
(cm)
Strength
Flexural
(MPa)
Compressive
(MPa)
CI
4.0
6.54
45.4
CIG
5.0
7.15
55.2
CI + 30%V
6.5
5.87
32.6
CI + 30%VG
6.5
5.55
35.2
CI + 30%S
3.5
4.86
25.1
CI + 30%SG
3.0
4.66
26.5
While interpreting the data shown in Figs. 4 and 5 it shall be mentioned that
additives of fly ash and ground granulated blast furnace slag were added in 30%
by mass, and the specific surface area presented in graphs refers to the additive
itself. Yet, the increase of the compressive strength of mortars can be observed along
with the increase of the specific surface area of the mineral additive used. Tests did
not prove a similar tendency in the flexural strength of mortars, but differences in