

68
Practical MATLAB
® Applications for Engineers
Example 1.9
Given the following analog transfer function:
H s
s
s
s
s
s
s
s
s
( ) ϭ
ϩ
ϩ Ϫ
Ϫ
ϩ
Ϫ
ϩ ϩ
3
2
5
4
3
2
3
5
3
9
6
2
4
5
Create the script fi le responses that returns the plots of the impulse and step responses
over the range given by 30 ≤ t ≤ 40.
MATLAB Solution
% Script file: responses
P= [1 3 5 -3];
Q= [9 -6 2 -4 1 5]; t = 0:0.5:50;
subplot(2,1,1);
Y1 = impulse(P,Q,t);
plot(t, Y1);
axis([30 40 -1e10 500e10])
title(‘analog impulse response’);
xlabel(‘time’);ylabel(‘Amplitude ’)
subplot(2,1,2);
Y2 = step(P,Q,t);
plot(t, Y2);ylabel(‘Amplitude ’);
axis([30 40 -16e9 1e13]);
title(‘analog step response’); xlabel (‘time’)
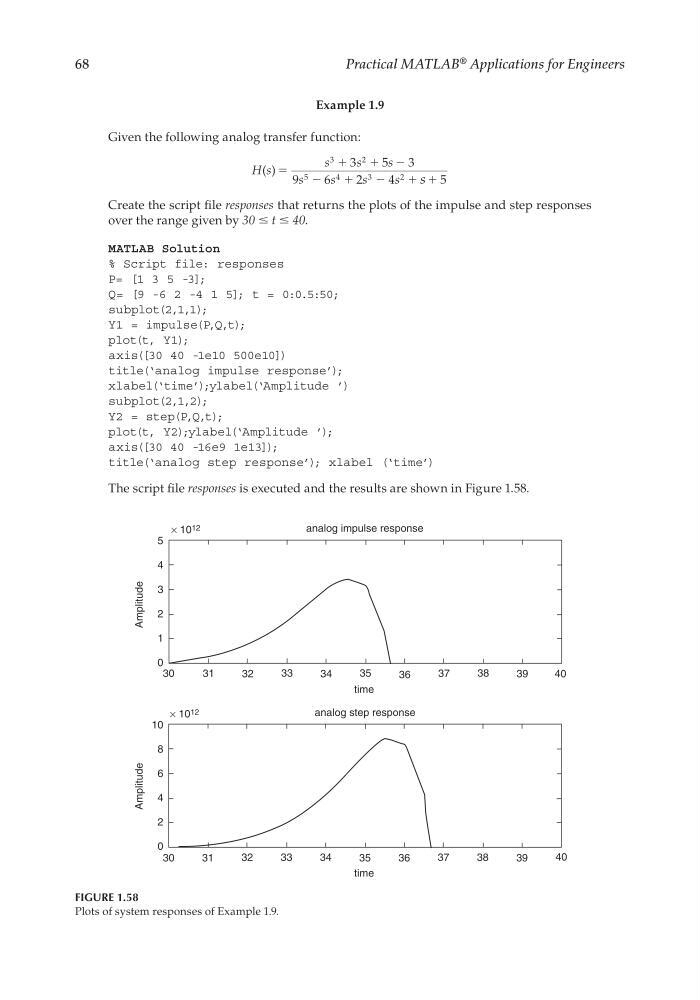
The script fi le responses is executed and the results are shown in Figure 1.58.
FIGURE 1.58
Plots of system responses of Example 1.9.
analog impulse response
× 10 12
× 10 12
5
4
3
2
1
0
30
30
31
32
33
34
35
36
37
38
39
40
31
32
33
34
35
36
37
38
39
40
Amplitude
Amplitude
time
analog step response
10
8
6
4
2
0
time
CRC_47760_CH001.indd 68
CRC_47760_CH001.indd 68
7/25/2008 4:16:24 PM
7/25/2008 4:16:24 PM
Practical MATLAB
® Applications for Engineers
Example 1.9
Given the following analog transfer function:
H s
s
s
s
s
s
s
s
s
( ) ϭ
ϩ
ϩ Ϫ
Ϫ
ϩ
Ϫ
ϩ ϩ
3
2
5
4
3
2
3
5
3
9
6
2
4
5
Create the script fi le responses that returns the plots of the impulse and step responses
over the range given by 30 ≤ t ≤ 40.
MATLAB Solution
% Script file: responses
P= [1 3 5 -3];
Q= [9 -6 2 -4 1 5]; t = 0:0.5:50;
subplot(2,1,1);
Y1 = impulse(P,Q,t);
plot(t, Y1);
axis([30 40 -1e10 500e10])
title(‘analog impulse response’);
xlabel(‘time’);ylabel(‘Amplitude ’)
subplot(2,1,2);
Y2 = step(P,Q,t);
plot(t, Y2);ylabel(‘Amplitude ’);
axis([30 40 -16e9 1e13]);
title(‘analog step response’); xlabel (‘time’)
The script fi le responses is executed and the results are shown in Figure 1.58.
FIGURE 1.58
Plots of system responses of Example 1.9.
analog impulse response
× 10 12
× 10 12
5
4
3
2
1
0
30
30
31
32
33
34
35
36
37
38
39
40
31
32
33
34
35
36
37
38
39
40
Amplitude
Amplitude
time
analog step response
10
8
6
4
2
0
time
CRC_47760_CH001.indd 68
CRC_47760_CH001.indd 68
7/25/2008 4:16:24 PM
7/25/2008 4:16:24 PM