

608
Practical MATLAB
® Applications for Engineers
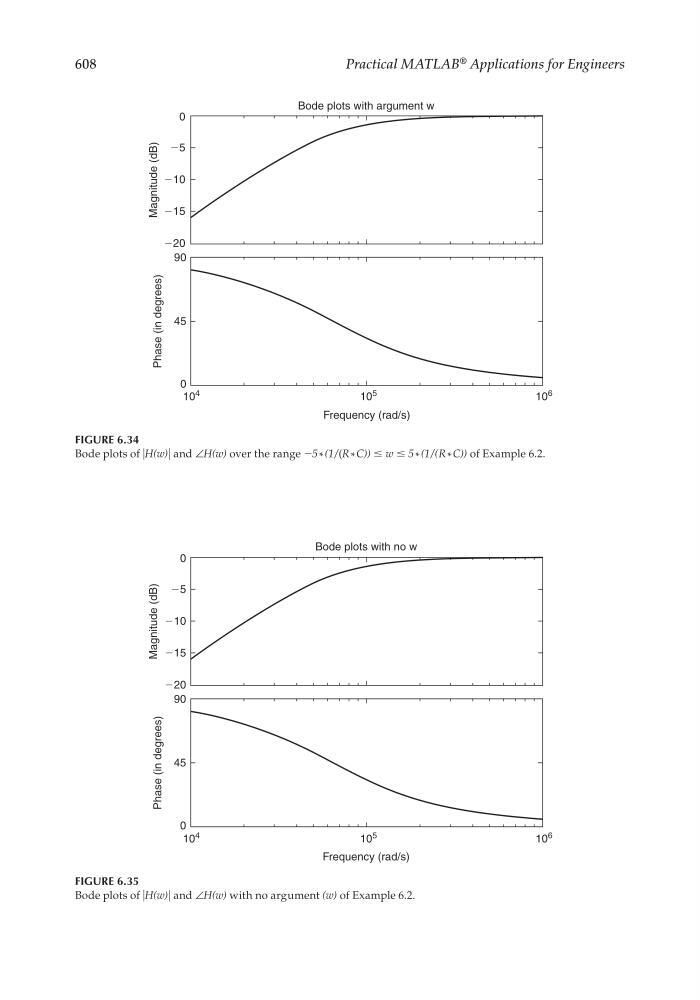
FIGURE 6.34
Bode plots of ͉H(w)͉ and ∠H(w) over the range −5 * (1/(R * C)) ≤ w ≤ 5 * (1/(R * C)) of Example 6.2.
0
Bode plots with argument w
Frequency (rad/s)
10 4
10
5
10
6
Ϫ5
Ϫ10
Ϫ20
90
45
Phase (in degrees)
Magnitude (dB)
0
Ϫ15
FIGURE 6.35
Bode plots of ͉H(w)͉ and ∠H(w) with no argument (w) of Example 6.2.
0
Bode plots with no w
Frequency (rad/s)
10
4
10
5
10
6
Ϫ5
Ϫ10
Ϫ20
90
45
Phase (in degrees)
Magnitude (dB)
0
Ϫ15
CRC_47760_CH006.indd 608
CRC_47760_CH006.indd 608
7/23/2008 2:26:45 PM
7/23/2008 2:26:45 PM