

DTFT, DFT, ZT, and FFT
513
−8
0.6
0.8
1
1.2
Magnitude
Phase angle in rad.
1.4
1.6
−6
−4
−2
0
frequency W
2
4
6
8
−8
−6
−4
−2
0
2
4
6
8
−0.4
−0.2
0
0.2
0.4
frequency W
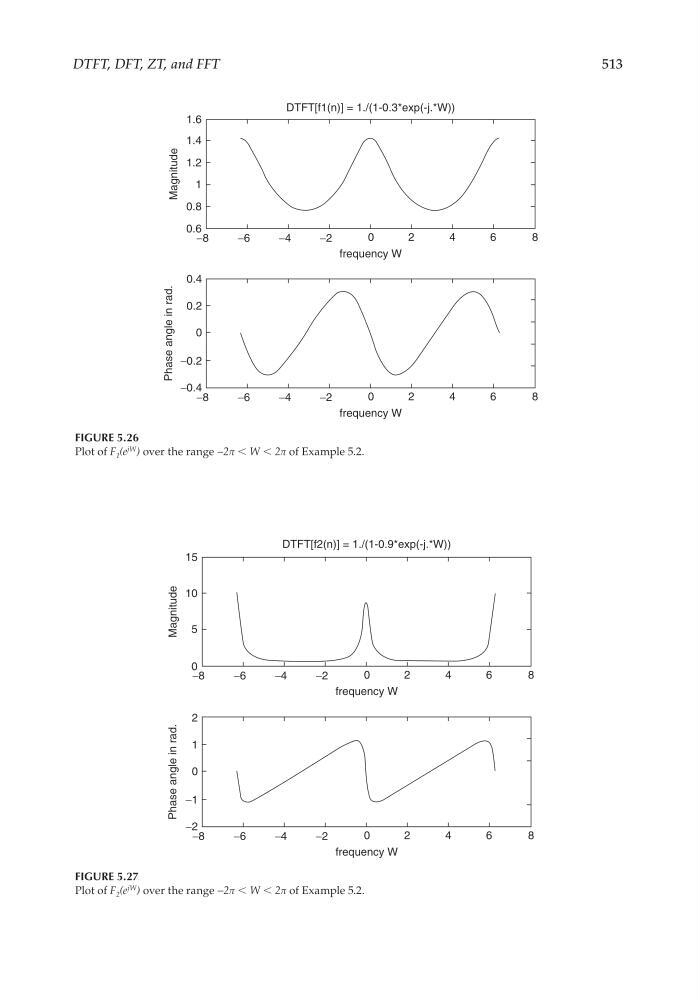
DTFT[f1(n)] = 1./(1-0.3*exp(-j.*W))
FIGURE 5.26
Plot of F 1 (e
jW ) over the range −2π < W < 2π of Example 5.2.
−8
0
5
10
Magnitude
Phase angle in rad.
15
−6
−4
−2
0
frequency W
2
4
6
8
−8
−6
−4
−2
0
2
4
6
8
−2
−1
0
1
2
frequency W
DTFT[f2(n)] = 1./(1-0.9*exp(-j.*W))
FIGURE 5.27
Plot of F 2 (e
jW ) over the range −2π < W < 2π of Example 5.2.
CRC_47760_CH005.indd 513
CRC_47760_CH005.indd 513
7/23/2008 1:47:32 PM
7/23/2008 1:47:32 PM
513
−8
0.6
0.8
1
1.2
Magnitude
Phase angle in rad.
1.4
1.6
−6
−4
−2
0
frequency W
2
4
6
8
−8
−6
−4
−2
0
2
4
6
8
−0.4
−0.2
0
0.2
0.4
frequency W
DTFT[f1(n)] = 1./(1-0.3*exp(-j.*W))
FIGURE 5.26
Plot of F 1 (e
jW ) over the range −2π < W < 2π of Example 5.2.
−8
0
5
10
Magnitude
Phase angle in rad.
15
−6
−4
−2
0
frequency W
2
4
6
8
−8
−6
−4
−2
0
2
4
6
8
−2
−1
0
1
2
frequency W
DTFT[f2(n)] = 1./(1-0.9*exp(-j.*W))
FIGURE 5.27
Plot of F 2 (e
jW ) over the range −2π < W < 2π of Example 5.2.
CRC_47760_CH005.indd 513
CRC_47760_CH005.indd 513
7/23/2008 1:47:32 PM
7/23/2008 1:47:32 PM