

Fourier and Laplace
447
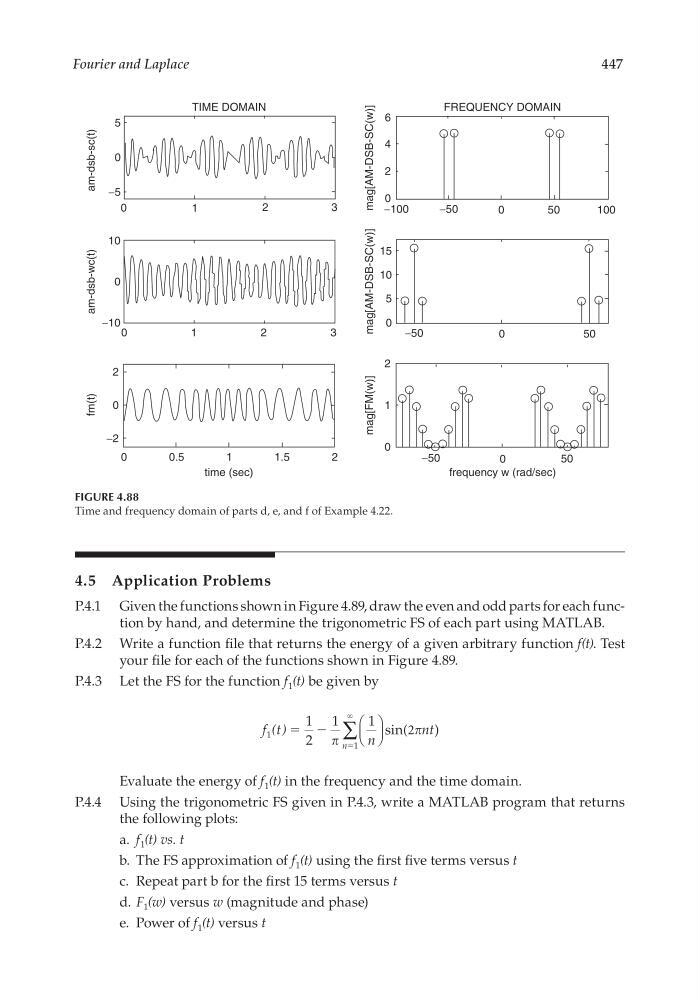
FIGURE 4.88
Time and frequency domain of parts d, e, and f of Example 4.22.
0
0
5
−5
1
2
3
0
1
2
3
0
0
0
2
−2
−10
10
0.5
2
1
1.5
time (sec)
fm(t)
am-dsb-wc(t)
am-dsb-sc(t)
−100
−50
−50
0
0
50
10
15
50
−50
0
50
100
0
0
0
1
2
2
4
5
6
frequency w (rad/sec)
mag[FM(w)]
mag[AM-DSB-SC(w)]
mag[AM-DSB-SC(w)]
TIME DOMAIN
FREQUENCY DOMAIN
4.5 Application Problems
P.4.1 Given the functions shown in Figure 4.89, draw the even and odd parts for each function by hand, and determine the trigonometric FS of each part using MATLAB.
P.4.2 Write a function fi le that returns the energy of a given arbitrary function f(t). Test
your fi le for each of the functions shown in Figure 4.89.
P.4.3 Let the FS for the function f 1 (t) be given by
f t
n
nt
n
1
)
( ) ϭ
ϭ
1
2
1
1
1
Ϫ
ϱ
∑ sin(2
Evaluate the energy of f 1 (t) in the frequency and the time domain.
P.4.4 Using the trigonometric FS given in P.4.3, write a MATLAB program that returns
the following plots:
a. f 1 (t) vs. t
b. The FS approximation of f 1 (t) using the fi rst fi ve terms versus t
c. Repeat part b for the fi rst 15 terms versus t
d. F 1 (w) versus w (magnitude and phase)
e. Power of f 1 (t) versus t
CRC_47760_CH004.indd 447
CRC_47760_CH004.indd 447
7/28/2008 12:26:24 PM
7/28/2008 12:26:24 PM
447
FIGURE 4.88
Time and frequency domain of parts d, e, and f of Example 4.22.
0
0
5
−5
1
2
3
0
1
2
3
0
0
0
2
−2
−10
10
0.5
2
1
1.5
time (sec)
fm(t)
am-dsb-wc(t)
am-dsb-sc(t)
−100
−50
−50
0
0
50
10
15
50
−50
0
50
100
0
0
0
1
2
2
4
5
6
frequency w (rad/sec)
mag[FM(w)]
mag[AM-DSB-SC(w)]
mag[AM-DSB-SC(w)]
TIME DOMAIN
FREQUENCY DOMAIN
4.5 Application Problems
P.4.1 Given the functions shown in Figure 4.89, draw the even and odd parts for each function by hand, and determine the trigonometric FS of each part using MATLAB.
P.4.2 Write a function fi le that returns the energy of a given arbitrary function f(t). Test
your fi le for each of the functions shown in Figure 4.89.
P.4.3 Let the FS for the function f 1 (t) be given by
f t
n
nt
n
1
)
( ) ϭ
ϭ
1
2
1
1
1
Ϫ
ϱ
∑ sin(2
Evaluate the energy of f 1 (t) in the frequency and the time domain.
P.4.4 Using the trigonometric FS given in P.4.3, write a MATLAB program that returns
the following plots:
a. f 1 (t) vs. t
b. The FS approximation of f 1 (t) using the fi rst fi ve terms versus t
c. Repeat part b for the fi rst 15 terms versus t
d. F 1 (w) versus w (magnitude and phase)
e. Power of f 1 (t) versus t
CRC_47760_CH004.indd 447
CRC_47760_CH004.indd 447
7/28/2008 12:26:24 PM
7/28/2008 12:26:24 PM