

Fourier and Laplace
427
0
0.1
0.2
0.3
0.4
0.5
0.6
0.7
0.8
0.9
1
10
5
10
0
10
−5
10
−10
10
−15
10
−20
Power Spectral Density (PSD)
Frequency
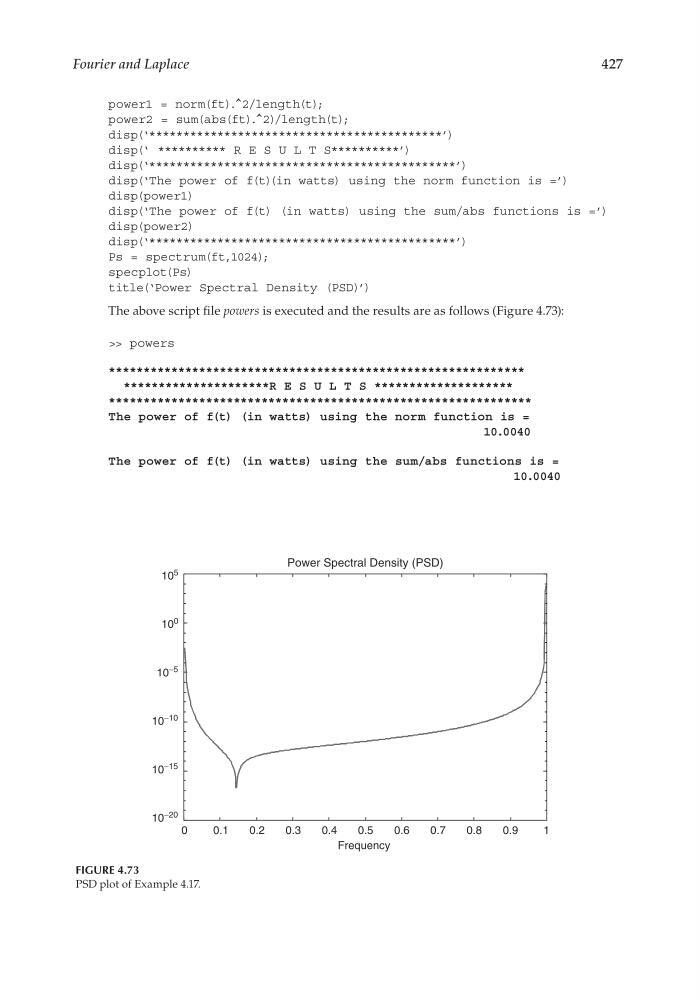
FIGURE 4.73
PSD plot of Example 4.17.
power1 = norm(ft).^2/length(t);
power2 = sum(abs(ft).^2)/length(t);
disp(‘*******************************************’)
disp(‘ ********** R E S U L T S**********’)
disp(‘*********************************************’)
disp(‘The power of f(t)(in watts) using the norm function is =’)
disp(power1)
disp(‘The power of f(t) (in watts) using the sum/abs functions is =’)
disp(power2)
disp(‘*********************************************’)
Ps = spectrum(ft,1024);
specplot(Ps)
title(‘Power Spectral Density (PSD)’)
The above script fi le powers is executed and the results are as follows (Figure 4.73):
>> powers
************************************************************
*********************R E S U L T S ********************
*************************************************************
The power of f(t) (in watts) using the norm function is =
10.0040
The power of f(t) (in watts) using the sum/abs functions is =
10.0040
CRC_47760_CH004.indd 427
CRC_47760_CH004.indd 427
7/28/2008 12:26:18 PM
7/28/2008 12:26:18 PM
427
0
0.1
0.2
0.3
0.4
0.5
0.6
0.7
0.8
0.9
1
10
5
10
0
10
−5
10
−10
10
−15
10
−20
Power Spectral Density (PSD)
Frequency
FIGURE 4.73
PSD plot of Example 4.17.
power1 = norm(ft).^2/length(t);
power2 = sum(abs(ft).^2)/length(t);
disp(‘*******************************************’)
disp(‘ ********** R E S U L T S**********’)
disp(‘*********************************************’)
disp(‘The power of f(t)(in watts) using the norm function is =’)
disp(power1)
disp(‘The power of f(t) (in watts) using the sum/abs functions is =’)
disp(power2)
disp(‘*********************************************’)
Ps = spectrum(ft,1024);
specplot(Ps)
title(‘Power Spectral Density (PSD)’)
The above script fi le powers is executed and the results are as follows (Figure 4.73):
>> powers
************************************************************
*********************R E S U L T S ********************
*************************************************************
The power of f(t) (in watts) using the norm function is =
10.0040
The power of f(t) (in watts) using the sum/abs functions is =
10.0040
CRC_47760_CH004.indd 427
CRC_47760_CH004.indd 427
7/28/2008 12:26:18 PM
7/28/2008 12:26:18 PM