

7.6 Outcome of Characterization
147
Table 7.1 Parameters of TG-DTA for CS, GCS and GDCS
Sample T onset (°C)
T max (°C)
T final (°C)
Weight loss (%)
CS
248.54
279.92
294.76
53.41
GCS
130.24/358.12
269.14/450.45
304.25/512.29
82.22
GDCS 192.8/364.88/536.3 74.65/278.99/450.81 129.76/310.18/464.45 90.31
DCS molecules decay. Once diethylenetriamine was grafted onto the backbone of
DCS, and three stages of decay were noticed; the first stage was in the limit of 43.32–
123.87 °C, which is due to loss of moisture due to evaporation; the second stage was
in the limit of 204.54–299.43 °C, allocated to the depolymerization and decomposition of GDCS molecules’ acetylated and deacetylated units [33]. The third stage
was 414.21–432.99 °C, resulting from the decline of GDCS molecules.
7.6.5 BET Investigation Outcome
The CS, DCS and GDCS values for the BET surface area, pore volume and pore size
are highlighted in Table 7.2. In the Table, GDCS surface area, pore volume and pore
size values as compared were greater than those of other beads, which were however
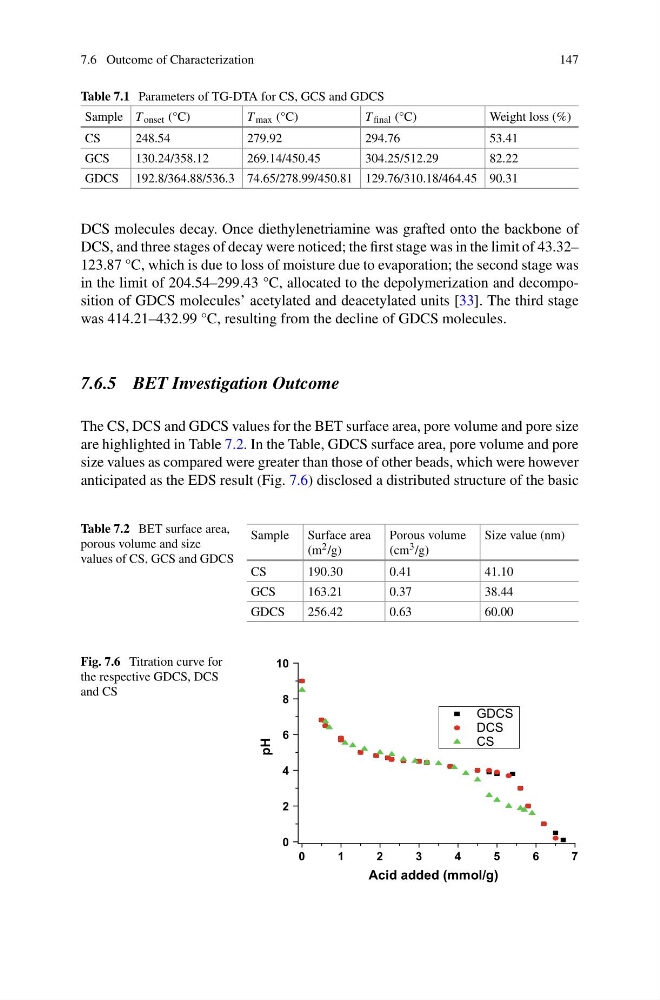
anticipated as the EDS result (Fig. 7.6) disclosed a distributed structure of the basic
Table 7.2 BET surface area,
porous volume and size
values of CS, GCS and GDCS
Sample Surface area
(m 2 /g)
Porous volume
(cm 3 /g)
Size value (nm)
CS
190.30
0.41
41.10
GCS
163.21
0.37
38.44
GDCS
256.42
0.63
60.00
Fig. 7.6 Titration curve for
the respective GDCS, DCS
and CS
0
1
2
3
4
5
6
7
0
2
4
6
8
10
pH
Acid added (mmol/g)
GDCS
DCS
CS
147
Table 7.1 Parameters of TG-DTA for CS, GCS and GDCS
Sample T onset (°C)
T max (°C)
T final (°C)
Weight loss (%)
CS
248.54
279.92
294.76
53.41
GCS
130.24/358.12
269.14/450.45
304.25/512.29
82.22
GDCS 192.8/364.88/536.3 74.65/278.99/450.81 129.76/310.18/464.45 90.31
DCS molecules decay. Once diethylenetriamine was grafted onto the backbone of
DCS, and three stages of decay were noticed; the first stage was in the limit of 43.32–
123.87 °C, which is due to loss of moisture due to evaporation; the second stage was
in the limit of 204.54–299.43 °C, allocated to the depolymerization and decomposition of GDCS molecules’ acetylated and deacetylated units [33]. The third stage
was 414.21–432.99 °C, resulting from the decline of GDCS molecules.
7.6.5 BET Investigation Outcome
The CS, DCS and GDCS values for the BET surface area, pore volume and pore size
are highlighted in Table 7.2. In the Table, GDCS surface area, pore volume and pore
size values as compared were greater than those of other beads, which were however
anticipated as the EDS result (Fig. 7.6) disclosed a distributed structure of the basic
Table 7.2 BET surface area,
porous volume and size
values of CS, GCS and GDCS
Sample Surface area
(m 2 /g)
Porous volume
(cm 3 /g)
Size value (nm)
CS
190.30
0.41
41.10
GCS
163.21
0.37
38.44
GDCS
256.42
0.63
60.00
Fig. 7.6 Titration curve for
the respective GDCS, DCS
and CS
0
1
2
3
4
5
6
7
0
2
4
6
8
10
pH
Acid added (mmol/g)
GDCS
DCS
CS