

7.6 Outcome of Characterization
145
1000
2000
3000
4000
0
100
200
300
705
1616
1662
2950
2840
1020
(NH 2 & OH)
3386
(NH 2 & OH)
3463
1020
1000
1512
1817
2159
2118
2847
(NH 2 & OH)
3396
% transmittance (a.u)
GDCS
DCS
CS
1734
1577
1373
1217
1508
777
1650
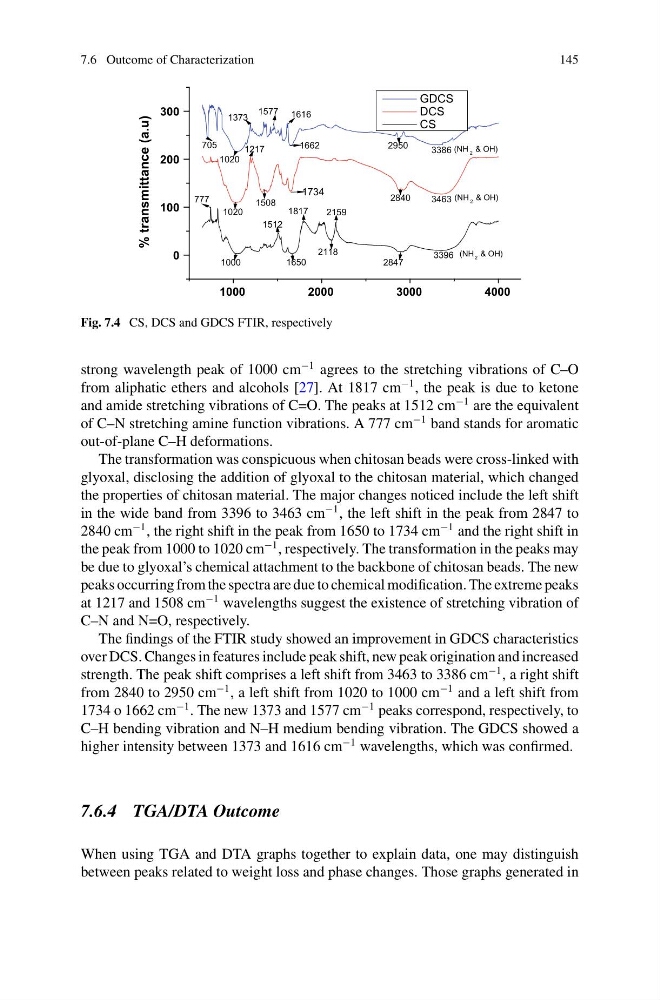
Fig. 7.4 CS, DCS and GDCS FTIR, respectively
strong wavelength peak of 1000 cm
−1 agrees to the stretching vibrations of C–O
from aliphatic ethers and alcohols [27]. At 1817 cm
−1 , the peak is due to ketone
and amide stretching vibrations of C=O. The peaks at 1512 cm
−1 are the equivalent
of C–N stretching amine function vibrations. A 777 cm
−1 band stands for aromatic
out-of-plane C–H deformations.
The transformation was conspicuous when chitosan beads were cross-linked with
glyoxal, disclosing the addition of glyoxal to the chitosan material, which changed
the properties of chitosan material. The major changes noticed include the left shift
in the wide band from 3396 to 3463 cm
−1 , the left shift in the peak from 2847 to
2840 cm
−1 , the right shift in the peak from 1650 to 1734 cm
−1 and the right shift in
the peak from 1000 to 1020 cm
−1 , respectively. The transformation in the peaks may
be due to glyoxal’s chemical attachment to the backbone of chitosan beads. The new
peaks occurring from the spectra are due to chemical modification. The extreme peaks
at 1217 and 1508 cm
−1 wavelengths suggest the existence of stretching vibration of
C–N and N=O, respectively.
The findings of the FTIR study showed an improvement in GDCS characteristics
over DCS. Changes in features include peak shift, new peak origination and increased
strength. The peak shift comprises a left shift from 3463 to 3386 cm
−1 , a right shift
from 2840 to 2950 cm
−1 , a left shift from 1020 to 1000 cm
−1 and a left shift from
1734 o 1662 cm
−1 . The new 1373 and 1577 cm
−1 peaks correspond, respectively, to
C–H bending vibration and N–H medium bending vibration. The GDCS showed a
higher intensity between 1373 and 1616 cm
−1 wavelengths, which was confirmed.
7.6.4 TGA/DTA Outcome
When using TGA and DTA graphs together to explain data, one may distinguish
between peaks related to weight loss and phase changes. Those graphs generated in
145
1000
2000
3000
4000
0
100
200
300
705
1616
1662
2950
2840
1020
(NH 2 & OH)
3386
(NH 2 & OH)
3463
1020
1000
1512
1817
2159
2118
2847
(NH 2 & OH)
3396
% transmittance (a.u)
GDCS
DCS
CS
1734
1577
1373
1217
1508
777
1650
Fig. 7.4 CS, DCS and GDCS FTIR, respectively
strong wavelength peak of 1000 cm
−1 agrees to the stretching vibrations of C–O
from aliphatic ethers and alcohols [27]. At 1817 cm
−1 , the peak is due to ketone
and amide stretching vibrations of C=O. The peaks at 1512 cm
−1 are the equivalent
of C–N stretching amine function vibrations. A 777 cm
−1 band stands for aromatic
out-of-plane C–H deformations.
The transformation was conspicuous when chitosan beads were cross-linked with
glyoxal, disclosing the addition of glyoxal to the chitosan material, which changed
the properties of chitosan material. The major changes noticed include the left shift
in the wide band from 3396 to 3463 cm
−1 , the left shift in the peak from 2847 to
2840 cm
−1 , the right shift in the peak from 1650 to 1734 cm
−1 and the right shift in
the peak from 1000 to 1020 cm
−1 , respectively. The transformation in the peaks may
be due to glyoxal’s chemical attachment to the backbone of chitosan beads. The new
peaks occurring from the spectra are due to chemical modification. The extreme peaks
at 1217 and 1508 cm
−1 wavelengths suggest the existence of stretching vibration of
C–N and N=O, respectively.
The findings of the FTIR study showed an improvement in GDCS characteristics
over DCS. Changes in features include peak shift, new peak origination and increased
strength. The peak shift comprises a left shift from 3463 to 3386 cm
−1 , a right shift
from 2840 to 2950 cm
−1 , a left shift from 1020 to 1000 cm
−1 and a left shift from
1734 o 1662 cm
−1 . The new 1373 and 1577 cm
−1 peaks correspond, respectively, to
C–H bending vibration and N–H medium bending vibration. The GDCS showed a
higher intensity between 1373 and 1616 cm
−1 wavelengths, which was confirmed.
7.6.4 TGA/DTA Outcome
When using TGA and DTA graphs together to explain data, one may distinguish
between peaks related to weight loss and phase changes. Those graphs generated in