

4.10 Outcome of Adsorption Investigation
87
4.10.2 Outcome of Temperature and Thermodynamic
Investigation
Figure 4.8 displays the significant impact of temperature on the maximum adsorption
capacity (Q m ) of Cd(II) and Pb(II) IONS on GXCS, and it was noted that a temperature rise from 25 to 45 °C enhanced the adsorption capacity from 98.4 to 145 mg/g for
Cd(II) ions and from 92.9 to 114 mg/g for Pb(II) ions correspondingly. This increase
in adsorption capacity with increase in temperature indicates the adsorption process
is endothermic in nature. This trend strongly suggests that the adsorption process is
chemisorption.
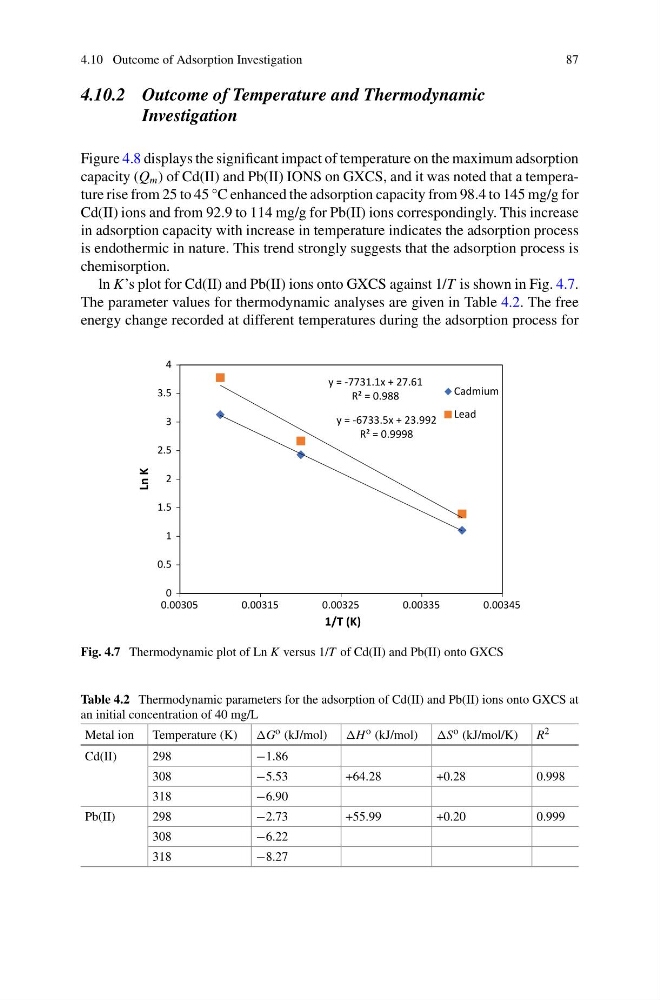
ln K’s plot for Cd(II) and Pb(II) ions onto GXCS against 1/T is shown in Fig. 4.7.
The parameter values for thermodynamic analyses are given in Table 4.2. The free
energy change recorded at different temperatures during the adsorption process for
y = -6733.5x + 23.992
R² = 0.9998
y = -7731.1x + 27.61
R² = 0.988
0
0.5
1
1.5
2
2.5
3
3.5
4
0.00305
0.00315
0.00325
0.00335
0.00345
Ln K
1/T (K)
Cadmium
Lead
Fig. 4.7 Thermodynamic plot of Ln K versus 1/T of Cd(II) and Pb(II) onto GXCS
Table 4.2 Thermodynamic parameters for the adsorption of Cd(II) and Pb(II) ions onto GXCS at
an initial concentration of 40 mg/L
Metal ion Temperature (K) o (kJ/mol) o (kJ/mol) o (kJ/mol/K) R 2
Cd(II)
298
−1.86
308
−5.53
+64.28
+0.28
0.998
318
−6.90
Pb(II)
298
−2.73
+55.99
+0.20
0.999
308
−6.22
318
−8.27
87
4.10.2 Outcome of Temperature and Thermodynamic
Investigation
Figure 4.8 displays the significant impact of temperature on the maximum adsorption
capacity (Q m ) of Cd(II) and Pb(II) IONS on GXCS, and it was noted that a temperature rise from 25 to 45 °C enhanced the adsorption capacity from 98.4 to 145 mg/g for
Cd(II) ions and from 92.9 to 114 mg/g for Pb(II) ions correspondingly. This increase
in adsorption capacity with increase in temperature indicates the adsorption process
is endothermic in nature. This trend strongly suggests that the adsorption process is
chemisorption.
ln K’s plot for Cd(II) and Pb(II) ions onto GXCS against 1/T is shown in Fig. 4.7.
The parameter values for thermodynamic analyses are given in Table 4.2. The free
energy change recorded at different temperatures during the adsorption process for
y = -6733.5x + 23.992
R² = 0.9998
y = -7731.1x + 27.61
R² = 0.988
0
0.5
1
1.5
2
2.5
3
3.5
4
0.00305
0.00315
0.00325
0.00335
0.00345
Ln K
1/T (K)
Cadmium
Lead
Fig. 4.7 Thermodynamic plot of Ln K versus 1/T of Cd(II) and Pb(II) onto GXCS
Table 4.2 Thermodynamic parameters for the adsorption of Cd(II) and Pb(II) ions onto GXCS at
an initial concentration of 40 mg/L
Metal ion Temperature (K) o (kJ/mol) o (kJ/mol) o (kJ/mol/K) R 2
Cd(II)
298
−1.86
308
−5.53
+64.28
+0.28
0.998
318
−6.90
Pb(II)
298
−2.73
+55.99
+0.20
0.999
308
−6.22
318
−8.27