

18
2.2.2 Climate Change
According to World Meteorological Organization (WMO), ‘climate’ is defined as
the 30 year average weather of any given area and ‘climate change’ is defined as the
changes in climate properties. It is a global phenomenon and probably the most
discussed phrase in the world today. Shifting weather patterns that threaten food
production and rising sea levels that increase the risk of catastrophic floods are
direct impacts of climate change. The change in climate may arise due to natural
processes such as change in solar radiation, volcanoes and internal variability in the
climate system or due to human activities that change the composition of the atmosphere. UN Intergovernmental Panel on Climate Change (IPCC) in 2013 categorically concluded that climate change is real and human activities are the main cause.
There are many evidences which suggest that Earth has experienced a number of
climate change events in the past since its formation 4.5 billion years ago. The last
ice-age event ended some 20,000 years ago and since then the Earth is in a warming
phase. Although the natural processes are occurring, the rapid change in climate is
due to various human activities since the first industrial revolution. Figure 2.4 shows
the change in earth temperature during the last 2000 years and Fig. 2.5 shows the
change in earth temperature in the last 140 years. The analysis of these two figures
clearly indicates that there is a rapid change in earth temperature since 1880.
IPCC have reported that the temperature of earth has increased approximately
1 °C (likely between 0.8 °C and 1.2 °C) in 2017, with respect to pre-industrialization temperature. This increase in temperature can be correlated with the augmented
level of anthropogenic greenhouse gases in the atmosphere. According to WMO
2018, CO 2 and CH 4 concentrations in the atmosphere have increased 147% and
0
50
100 150 200 250 300 350 400 450
Salinity (EC above 3000 micro mhos/ cm)
(EC : Electrical Conductivity)
Fluoride ( above 1.5 mg/l)
Nitrate (above 45 mg/l)
Arsenic (above 0.01 mg/l)
Iron (above 1 mg/l )
Lead (above 0.01 mg/l)
Cadmium (above 0.003 mg/l)
Chromium (above 0.05 mg/l)
GROUND WATER CONTAMINATION
Total no. of States
Total no. of Districts
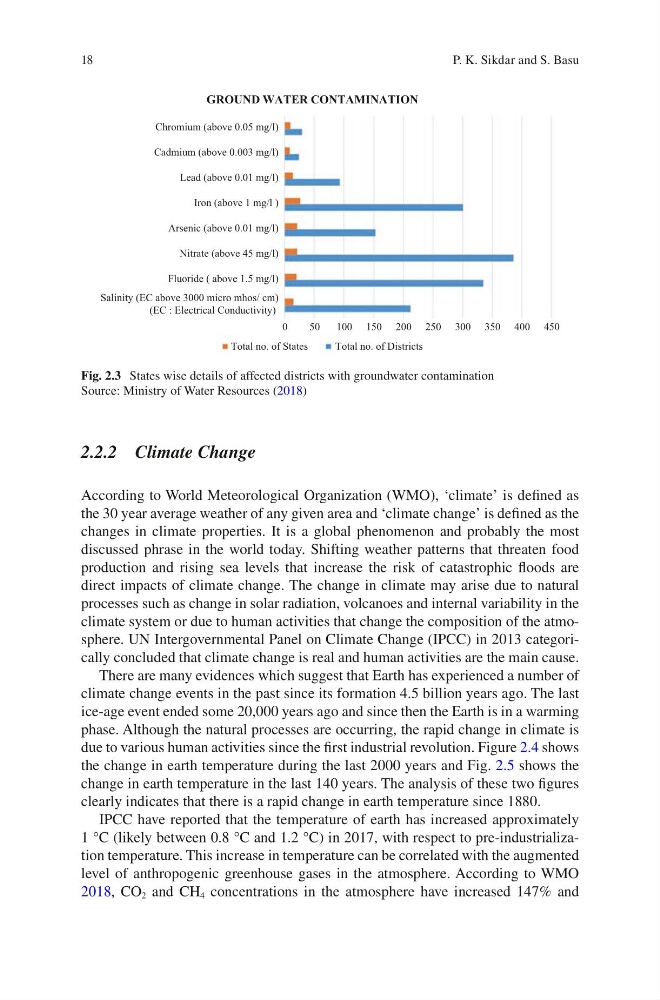
Fig. 2.3 States wise details of affected districts with groundwater contamination
Source: Ministry of Water Resources (2018)
P. K. Sikdar and S. Basu
2.2.2 Climate Change
According to World Meteorological Organization (WMO), ‘climate’ is defined as
the 30 year average weather of any given area and ‘climate change’ is defined as the
changes in climate properties. It is a global phenomenon and probably the most
discussed phrase in the world today. Shifting weather patterns that threaten food
production and rising sea levels that increase the risk of catastrophic floods are
direct impacts of climate change. The change in climate may arise due to natural
processes such as change in solar radiation, volcanoes and internal variability in the
climate system or due to human activities that change the composition of the atmosphere. UN Intergovernmental Panel on Climate Change (IPCC) in 2013 categorically concluded that climate change is real and human activities are the main cause.
There are many evidences which suggest that Earth has experienced a number of
climate change events in the past since its formation 4.5 billion years ago. The last
ice-age event ended some 20,000 years ago and since then the Earth is in a warming
phase. Although the natural processes are occurring, the rapid change in climate is
due to various human activities since the first industrial revolution. Figure 2.4 shows
the change in earth temperature during the last 2000 years and Fig. 2.5 shows the
change in earth temperature in the last 140 years. The analysis of these two figures
clearly indicates that there is a rapid change in earth temperature since 1880.
IPCC have reported that the temperature of earth has increased approximately
1 °C (likely between 0.8 °C and 1.2 °C) in 2017, with respect to pre-industrialization temperature. This increase in temperature can be correlated with the augmented
level of anthropogenic greenhouse gases in the atmosphere. According to WMO
2018, CO 2 and CH 4 concentrations in the atmosphere have increased 147% and
0
50
100 150 200 250 300 350 400 450
Salinity (EC above 3000 micro mhos/ cm)
(EC : Electrical Conductivity)
Fluoride ( above 1.5 mg/l)
Nitrate (above 45 mg/l)
Arsenic (above 0.01 mg/l)
Iron (above 1 mg/l )
Lead (above 0.01 mg/l)
Cadmium (above 0.003 mg/l)
Chromium (above 0.05 mg/l)
GROUND WATER CONTAMINATION
Total no. of States
Total no. of Districts
Fig. 2.3 States wise details of affected districts with groundwater contamination
Source: Ministry of Water Resources (2018)
P. K. Sikdar and S. Basu