

13
are in India in terms of PM 2.5 concentration in the air. The average PM 2.5 concentration in India was 72.54 μg/m
3
(WHO 2017) and India ranked third in terms of worst
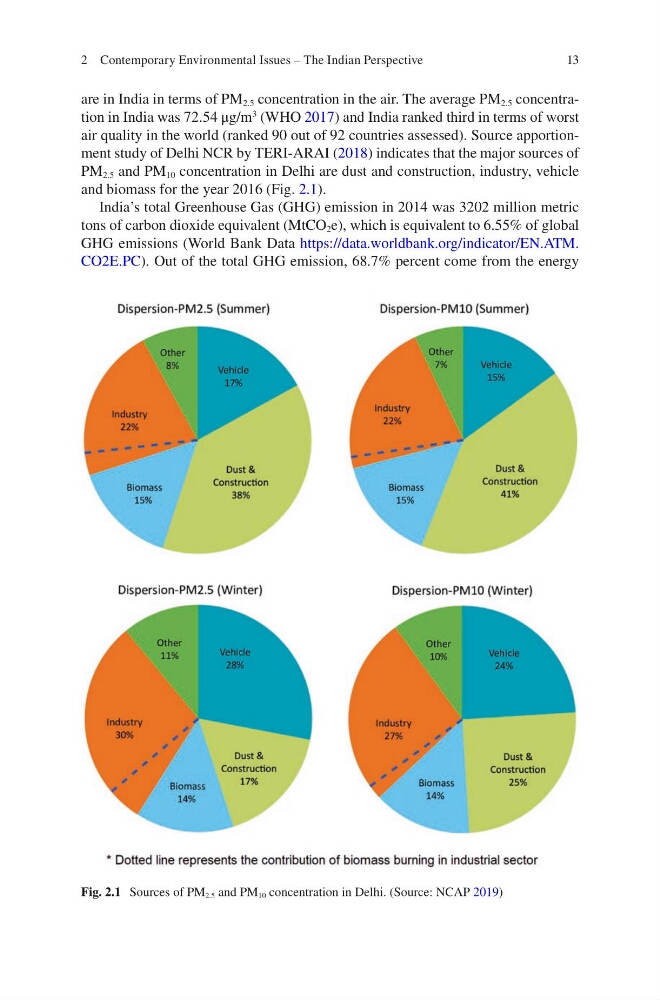
air quality in the world (ranked 90 out of 92 countries assessed). Source apportionment study of Delhi NCR by TERI-ARAI (2018) indicates that the major sources of
PM 2.5 and PM 10 concentration in Delhi are dust and construction, industry, vehicle
and biomass for the year 2016 (Fig. 2.1).
India’s total Greenhouse Gas (GHG) emission in 2014 was 3202 million metric
tons of carbon dioxide equivalent (MtCO 2 e), which is equivalent to 6.55% of global
GHG emissions (World Bank Data https://data.worldbank.org/indicator/EN.ATM.
CO2E.PC). Out of the total GHG emission, 68.7% percent come from the energy
Fig. 2.1 Sources of PM 2.5 and PM 10 concentration in Delhi. (Source: NCAP 2019)
2 Contemporary Environmental Issues – The Indian Perspective
are in India in terms of PM 2.5 concentration in the air. The average PM 2.5 concentration in India was 72.54 μg/m
3
(WHO 2017) and India ranked third in terms of worst
air quality in the world (ranked 90 out of 92 countries assessed). Source apportionment study of Delhi NCR by TERI-ARAI (2018) indicates that the major sources of
PM 2.5 and PM 10 concentration in Delhi are dust and construction, industry, vehicle
and biomass for the year 2016 (Fig. 2.1).
India’s total Greenhouse Gas (GHG) emission in 2014 was 3202 million metric
tons of carbon dioxide equivalent (MtCO 2 e), which is equivalent to 6.55% of global
GHG emissions (World Bank Data https://data.worldbank.org/indicator/EN.ATM.
CO2E.PC). Out of the total GHG emission, 68.7% percent come from the energy
Fig. 2.1 Sources of PM 2.5 and PM 10 concentration in Delhi. (Source: NCAP 2019)
2 Contemporary Environmental Issues – The Indian Perspective