

273
Manbazar-I, Manbazar-II, and Kashipur are consorted with −17—10. Nituria,
Santuri, Para, and Jhalda-II correspond with −9—8. Again Arsha, Purulia-I,
Purulia-II, Para, and Puncha are having the migration rate –7—2 (Fig. 15.7a). By
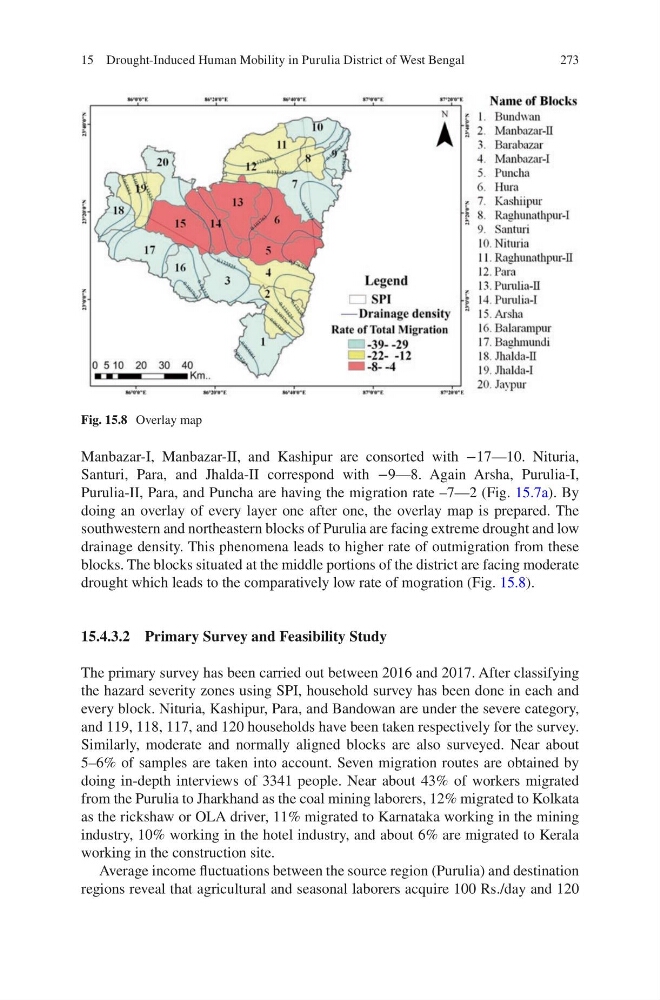
doing an overlay of every layer one after one, the overlay map is prepared. The
southwestern and northeastern blocks of Purulia are facing extreme drought and low
drainage density. This phenomena leads to higher rate of outmigration from these
blocks. The blocks situated at the middle portions of the district are facing moderate
drought which leads to the comparatively low rate of mogration (Fig. 15.8).
15.4.3.2 Primary Survey and Feasibility Study
The primary survey has been carried out between 2016 and 2017. After classifying
the hazard severity zones using SPI, household survey has been done in each and
every block. Nituria, Kashipur, Para, and Bandowan are under the severe category,
and 119, 118, 117, and 120 households have been taken respectively for the survey.
Similarly, moderate and normally aligned blocks are also surveyed. Near about
5–6% of samples are taken into account. Seven migration routes are obtained by
doing in-depth interviews of 3341 people. Near about 43% of workers migrated
from the Purulia to Jharkhand as the coal mining laborers, 12% migrated to Kolkata
as the rickshaw or OLA driver, 11% migrated to Karnataka working in the mining
industry, 10% working in the hotel industry, and about 6% are migrated to Kerala
working in the construction site.
Average income fluctuations between the source region (Purulia) and destination
regions reveal that agricultural and seasonal laborers acquire 100 Rs./day and 120
Fig. 15.8 Overlay map
15 Drought-Induced Human Mobility in Purulia District of West Bengal
Manbazar-I, Manbazar-II, and Kashipur are consorted with −17—10. Nituria,
Santuri, Para, and Jhalda-II correspond with −9—8. Again Arsha, Purulia-I,
Purulia-II, Para, and Puncha are having the migration rate –7—2 (Fig. 15.7a). By
doing an overlay of every layer one after one, the overlay map is prepared. The
southwestern and northeastern blocks of Purulia are facing extreme drought and low
drainage density. This phenomena leads to higher rate of outmigration from these
blocks. The blocks situated at the middle portions of the district are facing moderate
drought which leads to the comparatively low rate of mogration (Fig. 15.8).
15.4.3.2 Primary Survey and Feasibility Study
The primary survey has been carried out between 2016 and 2017. After classifying
the hazard severity zones using SPI, household survey has been done in each and
every block. Nituria, Kashipur, Para, and Bandowan are under the severe category,
and 119, 118, 117, and 120 households have been taken respectively for the survey.
Similarly, moderate and normally aligned blocks are also surveyed. Near about
5–6% of samples are taken into account. Seven migration routes are obtained by
doing in-depth interviews of 3341 people. Near about 43% of workers migrated
from the Purulia to Jharkhand as the coal mining laborers, 12% migrated to Kolkata
as the rickshaw or OLA driver, 11% migrated to Karnataka working in the mining
industry, 10% working in the hotel industry, and about 6% are migrated to Kerala
working in the construction site.
Average income fluctuations between the source region (Purulia) and destination
regions reveal that agricultural and seasonal laborers acquire 100 Rs./day and 120
Fig. 15.8 Overlay map
15 Drought-Induced Human Mobility in Purulia District of West Bengal