

272
production experienced 859.3 thousand tones. 2005–2006 is the year of severe
drought, production decreased, and reached to 451.24 thousand tones of production;
2010–2011 experiences extreme drought as a result production decreased and
reached to 303.2 thousand tones (Fig. 15.5c).
15.4.3.1 Labor Pattern Fluctuation and Migration Scenarios
The steady decrease in production affects the pattern of workers and the availability
of the job. Assessing the worker pattern from the census 2001 to 2011 clearly indicates that agricultural labors and cultivators are decreasing in number and they are
transforming into household industrial workers or engaged in other activities
(Fig. 15.6a, b, c). These scenarios surely express the insecurity in agriculture and
allied activities.
Agricultural labor is decreased by 1 percentage point, and cultivators are
decreased by 2 percentage points in a comparison of 2001–2011 (31–29%).
Household industrial workers and other workers have increased by 1% and 2% from
2001 to 2011, respectively. The decadal change of the main worker shows a negative
trend for all the blocks of the Purulia District, whereas marginal and nonworkers
tend to increase (Figure 15.6b).
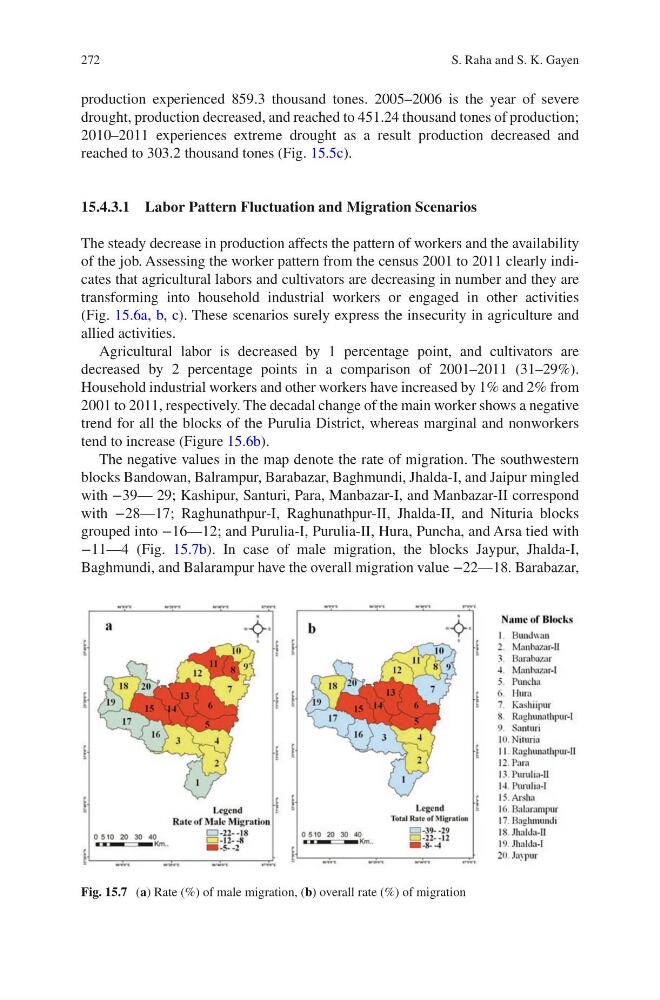
The negative values in the map denote the rate of migration. The southwestern
blocks Bandowan, Balrampur, Barabazar, Baghmundi, Jhalda-I, and Jaipur mingled
with −39— 29; Kashipur, Santuri, Para, Manbazar-I, and Manbazar-II correspond
with −28—17; Raghunathpur-I, Raghunathpur-II, Jhalda-II, and Nituria blocks
grouped into −16—12; and Purulia-I, Purulia-II, Hura, Puncha, and Arsa tied with
−11—4 (Fig. 15.7b). In case of male migration, the blocks Jaypur, Jhalda-I,
Baghmundi, and Balarampur have the overall migration value −22—18. Barabazar,
Fig. 15.7 (a) Rate (%) of male migration, (b) overall rate (%) of migration
S. Raha and S. K. Gayen
production experienced 859.3 thousand tones. 2005–2006 is the year of severe
drought, production decreased, and reached to 451.24 thousand tones of production;
2010–2011 experiences extreme drought as a result production decreased and
reached to 303.2 thousand tones (Fig. 15.5c).
15.4.3.1 Labor Pattern Fluctuation and Migration Scenarios
The steady decrease in production affects the pattern of workers and the availability
of the job. Assessing the worker pattern from the census 2001 to 2011 clearly indicates that agricultural labors and cultivators are decreasing in number and they are
transforming into household industrial workers or engaged in other activities
(Fig. 15.6a, b, c). These scenarios surely express the insecurity in agriculture and
allied activities.
Agricultural labor is decreased by 1 percentage point, and cultivators are
decreased by 2 percentage points in a comparison of 2001–2011 (31–29%).
Household industrial workers and other workers have increased by 1% and 2% from
2001 to 2011, respectively. The decadal change of the main worker shows a negative
trend for all the blocks of the Purulia District, whereas marginal and nonworkers
tend to increase (Figure 15.6b).
The negative values in the map denote the rate of migration. The southwestern
blocks Bandowan, Balrampur, Barabazar, Baghmundi, Jhalda-I, and Jaipur mingled
with −39— 29; Kashipur, Santuri, Para, Manbazar-I, and Manbazar-II correspond
with −28—17; Raghunathpur-I, Raghunathpur-II, Jhalda-II, and Nituria blocks
grouped into −16—12; and Purulia-I, Purulia-II, Hura, Puncha, and Arsa tied with
−11—4 (Fig. 15.7b). In case of male migration, the blocks Jaypur, Jhalda-I,
Baghmundi, and Balarampur have the overall migration value −22—18. Barabazar,
Fig. 15.7 (a) Rate (%) of male migration, (b) overall rate (%) of migration
S. Raha and S. K. Gayen