

269
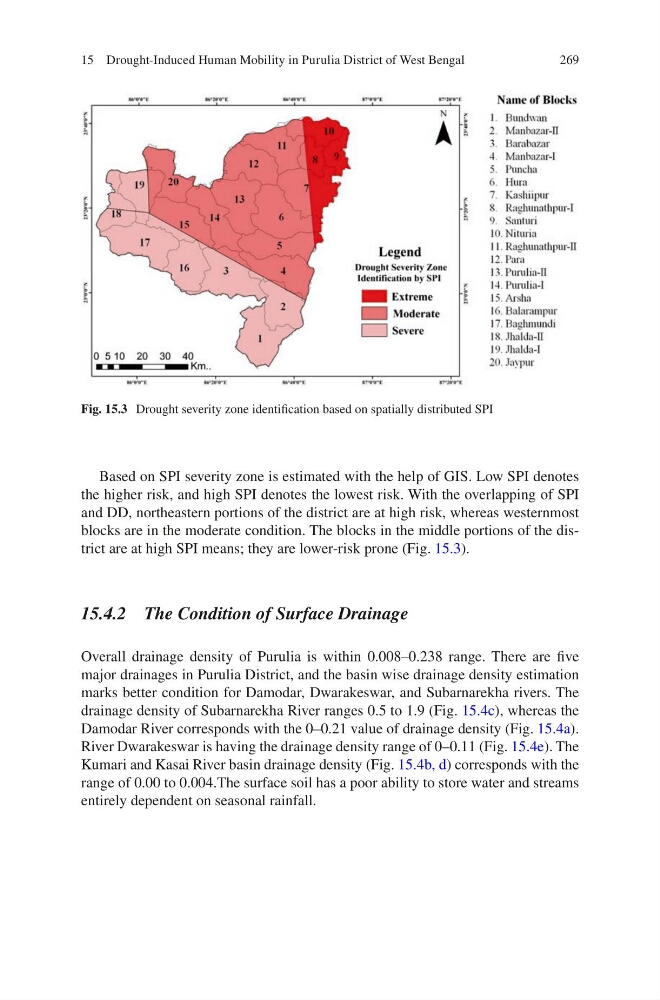
Based on SPI severity zone is estimated with the help of GIS. Low SPI denotes
the higher risk, and high SPI denotes the lowest risk. With the overlapping of SPI
and DD, northeastern portions of the district are at high risk, whereas westernmost
blocks are in the moderate condition. The blocks in the middle portions of the district are at high SPI means; they are lower-risk prone (Fig. 15.3).
15.4.2 The Condition of Surface Drainage
Overall drainage density of Purulia is within 0.008–0.238 range. There are five
major drainages in Purulia District, and the basin wise drainage density estimation
marks better condition for Damodar, Dwarakeswar, and Subarnarekha rivers. The
drainage density of Subarnarekha River ranges 0.5 to 1.9 (Fig. 15.4c), whereas the
Damodar River corresponds with the 0–0.21 value of drainage density (Fig. 15.4a).
River Dwarakeswar is having the drainage density range of 0–0.11 (Fig. 15.4e). The
Kumari and Kasai River basin drainage density (Fig. 15.4b, d) corresponds with the
range of 0.00 to 0.004.The surface soil has a poor ability to store water and streams
entirely dependent on seasonal rainfall.
Fig. 15.3 Drought severity zone identification based on spatially distributed SPI
15 Drought-Induced Human Mobility in Purulia District of West Bengal
Based on SPI severity zone is estimated with the help of GIS. Low SPI denotes
the higher risk, and high SPI denotes the lowest risk. With the overlapping of SPI
and DD, northeastern portions of the district are at high risk, whereas westernmost
blocks are in the moderate condition. The blocks in the middle portions of the district are at high SPI means; they are lower-risk prone (Fig. 15.3).
15.4.2 The Condition of Surface Drainage
Overall drainage density of Purulia is within 0.008–0.238 range. There are five
major drainages in Purulia District, and the basin wise drainage density estimation
marks better condition for Damodar, Dwarakeswar, and Subarnarekha rivers. The
drainage density of Subarnarekha River ranges 0.5 to 1.9 (Fig. 15.4c), whereas the
Damodar River corresponds with the 0–0.21 value of drainage density (Fig. 15.4a).
River Dwarakeswar is having the drainage density range of 0–0.11 (Fig. 15.4e). The
Kumari and Kasai River basin drainage density (Fig. 15.4b, d) corresponds with the
range of 0.00 to 0.004.The surface soil has a poor ability to store water and streams
entirely dependent on seasonal rainfall.
Fig. 15.3 Drought severity zone identification based on spatially distributed SPI
15 Drought-Induced Human Mobility in Purulia District of West Bengal