

268
So, if a system Ax = b then x ≥ 0 where A is an m*n matrix and b is an m-vector. It
is supposed that rank (A, b) = rank (A) = m. After processing and rearranging the
columns of A, let A = [B, N] where B is an m*m invertible matrix and N is the m*(nm) matrix. The solution x
x
x
B
N
=
to the equation Ax = b where x B = B
−1
b and x N = 0
is called the basic solution of the system. Here B is considered as the basic solution
and N is considered as the nonbasic matrix. x B are the basic variables under basic
solution, and the components of x N are called nonbasic variables, and x is called
degenerate basic feasible solution. In case of this study, the income generation
matrices are formed, and equations are formulated. Here, in all maximization formulation with ≥ sign, the highest value is taken in the feasible region unbounded
in nature.
15.4 Results and Discussion
15.4.1 Hazard Hotspot Identification Based on SPI
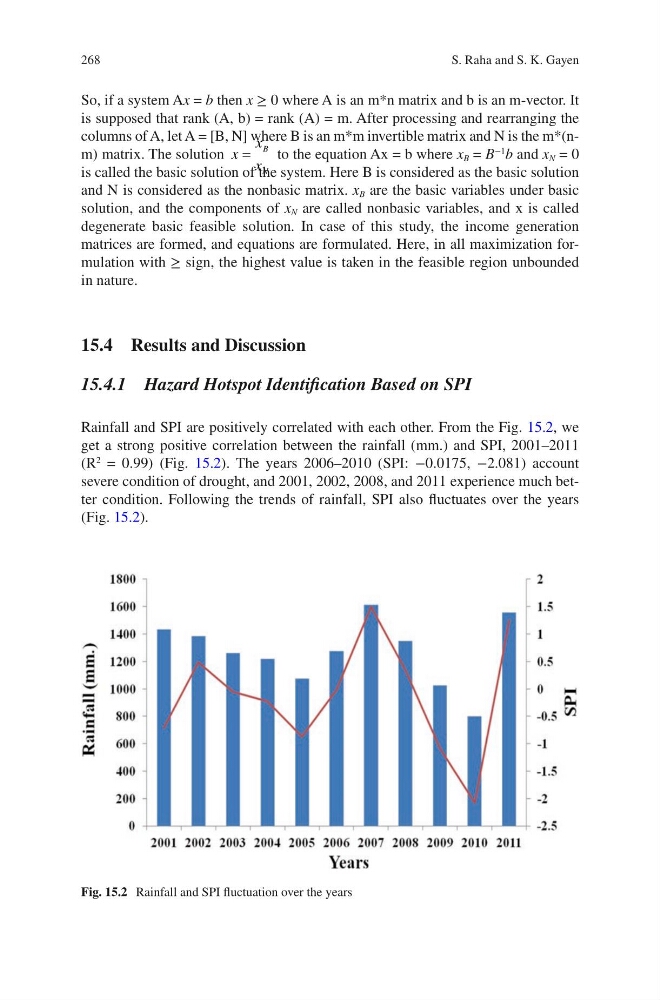
Rainfall and SPI are positively correlated with each other. From the Fig. 15.2, we
get a strong positive correlation between the rainfall (mm.) and SPI, 2001–2011
(R
2
= 0.99) (Fig. 15.2). The years 2006–2010 (SPI: −0.0175, −2.081) account
severe condition of drought, and 2001, 2002, 2008, and 2011 experience much better condition. Following the trends of rainfall, SPI also fluctuates over the years
(Fig. 15.2).
Fig. 15.2 Rainfall and SPI fluctuation over the years
S. Raha and S. K. Gayen
So, if a system Ax = b then x ≥ 0 where A is an m*n matrix and b is an m-vector. It
is supposed that rank (A, b) = rank (A) = m. After processing and rearranging the
columns of A, let A = [B, N] where B is an m*m invertible matrix and N is the m*(nm) matrix. The solution x
x
x
B
N
=
to the equation Ax = b where x B = B
−1
b and x N = 0
is called the basic solution of the system. Here B is considered as the basic solution
and N is considered as the nonbasic matrix. x B are the basic variables under basic
solution, and the components of x N are called nonbasic variables, and x is called
degenerate basic feasible solution. In case of this study, the income generation
matrices are formed, and equations are formulated. Here, in all maximization formulation with ≥ sign, the highest value is taken in the feasible region unbounded
in nature.
15.4 Results and Discussion
15.4.1 Hazard Hotspot Identification Based on SPI
Rainfall and SPI are positively correlated with each other. From the Fig. 15.2, we
get a strong positive correlation between the rainfall (mm.) and SPI, 2001–2011
(R
2
= 0.99) (Fig. 15.2). The years 2006–2010 (SPI: −0.0175, −2.081) account
severe condition of drought, and 2001, 2002, 2008, and 2011 experience much better condition. Following the trends of rainfall, SPI also fluctuates over the years
(Fig. 15.2).
Fig. 15.2 Rainfall and SPI fluctuation over the years
S. Raha and S. K. Gayen