

167
M
M M
M
ji
E
i
j
g
u
(9.1)
where M i = row total, M j = column total and M g = grand total.
Pearson’s chi-square method is used to show the degree of freedom between the
variable pairs to illustrate the changes in land use, by using the following equation:
(observed – expected)
2
/expected. This equation shows the degree of deviation
between observed impervious growth and expected impervious growth. Here, chisquare equation has been used to calculate degree of freedom for each time span by
using equation (9.2) shown in Table 9.6:
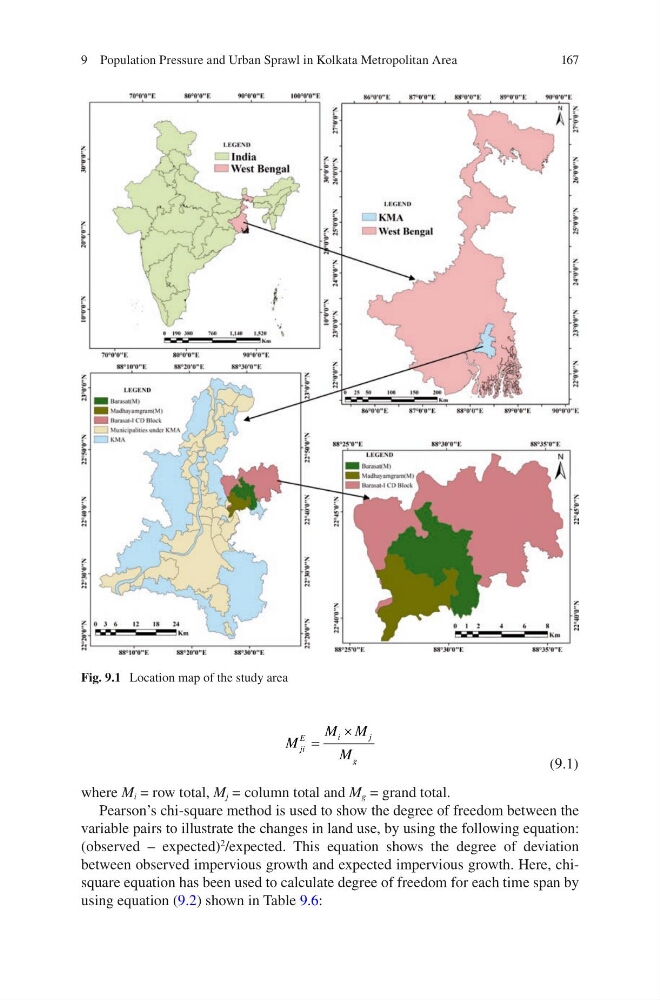
Fig. 9.1 Location map of the study area
9 Population Pressure and Urban Sprawl in Kolkata Metropolitan Area
M
M M
M
ji
E
i
j
g
u
(9.1)
where M i = row total, M j = column total and M g = grand total.
Pearson’s chi-square method is used to show the degree of freedom between the
variable pairs to illustrate the changes in land use, by using the following equation:
(observed – expected)
2
/expected. This equation shows the degree of deviation
between observed impervious growth and expected impervious growth. Here, chisquare equation has been used to calculate degree of freedom for each time span by
using equation (9.2) shown in Table 9.6:
Fig. 9.1 Location map of the study area
9 Population Pressure and Urban Sprawl in Kolkata Metropolitan Area