

84
total core forest area including core I, II and III decreased from 2099.94 sq.km. in
1990 to 1346.96 sq.km. in 2018. This decrease in the core forest area showed
that they have been continuously changing to lower density classes such as perforated, edge and patch classes (Dutta et al. 2017). This is mainly because the formation of patches happened due to various anthropogenic factors, such as construction
of roads, and increase in built-up area. Due to the expansion of settlements and
increase in agriculture as shown by the LULC, the shrinkage of forest takes place
and becomes fragmented as well. Hence, it is evident that this would eventually
make elephant populations isolated to small fragmented habitats. The maps below
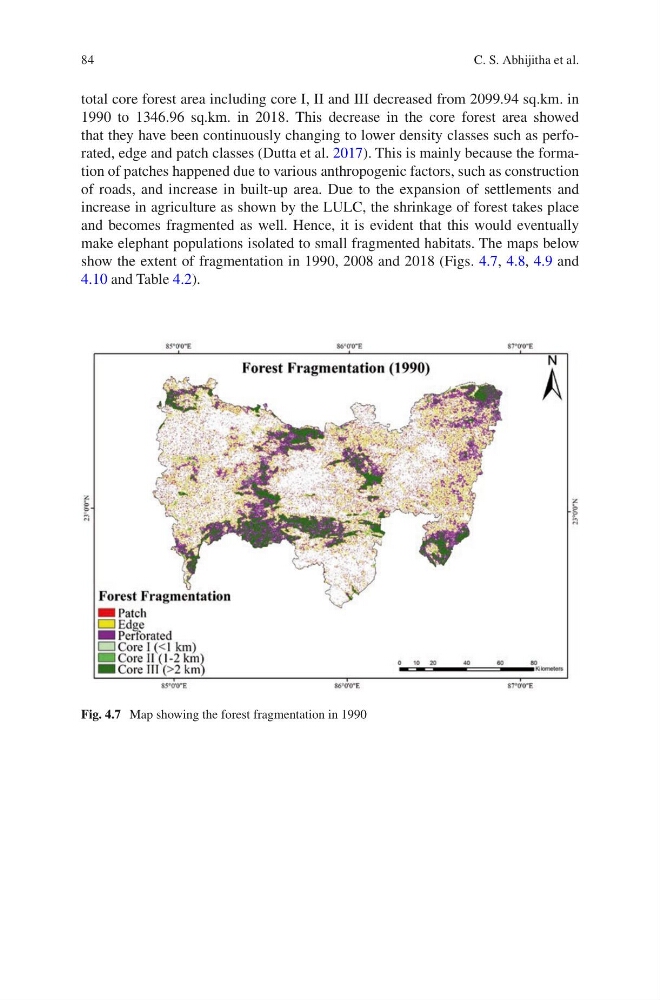
show the extent of fragmentation in 1990, 2008 and 2018 (Figs. 4.7, 4.8, 4.9 and
4.10 and Table 4.2).
Fig. 4.7 Map showing the forest fragmentation in 1990
C. S. Abhijitha et al.
total core forest area including core I, II and III decreased from 2099.94 sq.km. in
1990 to 1346.96 sq.km. in 2018. This decrease in the core forest area showed
that they have been continuously changing to lower density classes such as perforated, edge and patch classes (Dutta et al. 2017). This is mainly because the formation of patches happened due to various anthropogenic factors, such as construction
of roads, and increase in built-up area. Due to the expansion of settlements and
increase in agriculture as shown by the LULC, the shrinkage of forest takes place
and becomes fragmented as well. Hence, it is evident that this would eventually
make elephant populations isolated to small fragmented habitats. The maps below
show the extent of fragmentation in 1990, 2008 and 2018 (Figs. 4.7, 4.8, 4.9 and
4.10 and Table 4.2).
Fig. 4.7 Map showing the forest fragmentation in 1990
C. S. Abhijitha et al.