

35
Correlations of Gait Phase Kinematics and Cortical EEG: Modelling Human Gait with Data…
DOI: http://dx.doi.org/10.5772/intechopen.88465
develop a low-cost model that can be employed in the future as an off-laboratory
diagnosing tool for identifying gait abnormalities and classify human gait phases
and pathological disorders. With machine learning jointly with inverse dynamic
analysis using triaxial accelerometer sensors in today’s mobile phones, it may
be reliable to analyse the each joint kinematic and behaviour during swing and
stance phases that can further be used for the development of control strategies
to set up brain machine interfaces (BMI), human-machine interfaces (HMI) and
prostheses. Gait kinematic movement in terms of EEG allowed to understand
the cortical regions that are active during gait phases helps in diagnosing the gait
neurological disorders.
In this chapter, we address the usage of low-cost mobile phone-based accelerometer sensors in order to extract and analyse human gait patterns. Average torque and
the gait kinematic parameters of the lower body during stance and swing phases
were analysed to understand how gait can be attained. In this study, we compared
neural spectral representations from scalp EEG signals during active walking.
Simultaneous recording of EEG with gait and their analysis was done to interpret
cortical activity during the stance and swing phases of a gait cycle.
2. Methods
2.1 Low cost sensor-based gait recording and assessment
Gait data was extracted from 20 healthy volunteers using 12 smartphone-based
accelerometers and a software application that allowed synchronous collection of
data from the devices and mapped to additional parameters, including weight and
age. The data collection and methods were approved by the institutional ethical
review board and an open consent was collected from the participants prior to gait
and EEG recordings. A total of 40 trails and 120 gait cycle accelerometer data were
extracted from brachium of arm (shoulder), antecubitis (elbow), carpus (wrist),
coxal (hip), femur (knee) and tarsus (ankle) were taken for further analysis. The
extracted data was then normalized and sixth order Butterworth filter with a cutoff frequency of 10 Hz was used for noise reduction. Data processing was based on
the time noted by the observer during each gait phase (Figure 1A).
2.2 Estimating torque amplitude for each joint
This method employed 12 joint related positions to collect data from subjects.
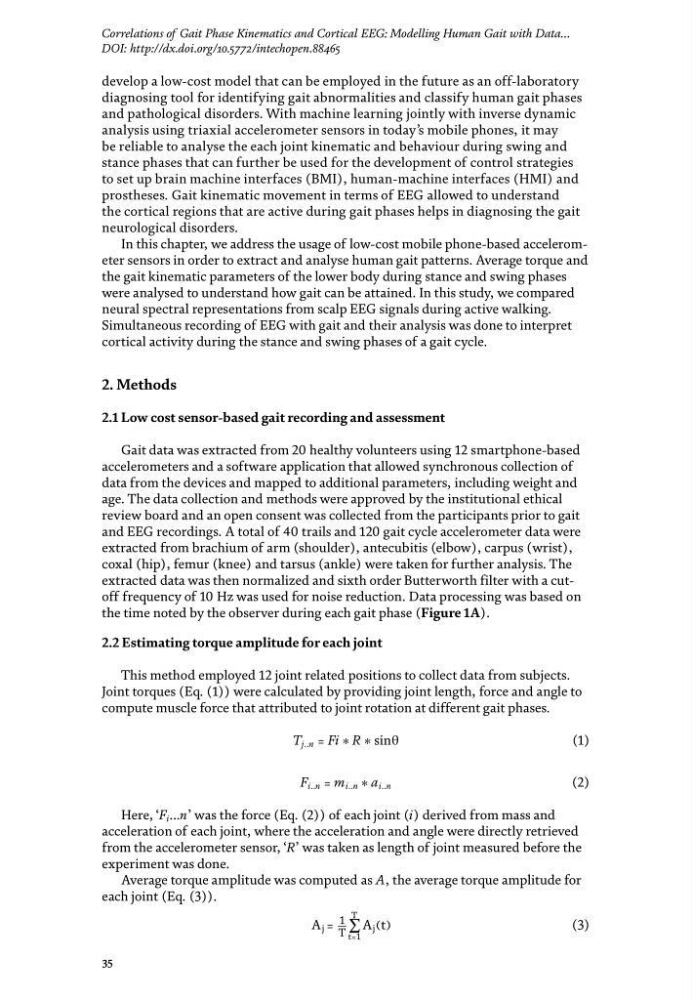
Joint torques (Eq. (1)) were calculated by providing joint length, force and angle to
compute muscle force that attributed to joint rotation at different gait phases.
T j..n = Fi ∗ R ∗ sin θ
(1)
F i..n = m i..n ∗ a i..n
(2)
Here, ‘F i ...n’ was the force (Eq. (2)) of each joint (i) derived from mass and
acceleration of each joint, where the acceleration and angle were directly retrieved
from the accelerometer sensor, ‘R’ was taken as length of joint measured before the
experiment was done.
Average torque amplitude was computed as A, the average torque amplitude for
each joint (Eq. (3)).
A j = 1
_
T
∑
t=1
T
A j (t)
(3)
Correlations of Gait Phase Kinematics and Cortical EEG: Modelling Human Gait with Data…
DOI: http://dx.doi.org/10.5772/intechopen.88465
develop a low-cost model that can be employed in the future as an off-laboratory
diagnosing tool for identifying gait abnormalities and classify human gait phases
and pathological disorders. With machine learning jointly with inverse dynamic
analysis using triaxial accelerometer sensors in today’s mobile phones, it may
be reliable to analyse the each joint kinematic and behaviour during swing and
stance phases that can further be used for the development of control strategies
to set up brain machine interfaces (BMI), human-machine interfaces (HMI) and
prostheses. Gait kinematic movement in terms of EEG allowed to understand
the cortical regions that are active during gait phases helps in diagnosing the gait
neurological disorders.
In this chapter, we address the usage of low-cost mobile phone-based accelerometer sensors in order to extract and analyse human gait patterns. Average torque and
the gait kinematic parameters of the lower body during stance and swing phases
were analysed to understand how gait can be attained. In this study, we compared
neural spectral representations from scalp EEG signals during active walking.
Simultaneous recording of EEG with gait and their analysis was done to interpret
cortical activity during the stance and swing phases of a gait cycle.
2. Methods
2.1 Low cost sensor-based gait recording and assessment
Gait data was extracted from 20 healthy volunteers using 12 smartphone-based
accelerometers and a software application that allowed synchronous collection of
data from the devices and mapped to additional parameters, including weight and
age. The data collection and methods were approved by the institutional ethical
review board and an open consent was collected from the participants prior to gait
and EEG recordings. A total of 40 trails and 120 gait cycle accelerometer data were
extracted from brachium of arm (shoulder), antecubitis (elbow), carpus (wrist),
coxal (hip), femur (knee) and tarsus (ankle) were taken for further analysis. The
extracted data was then normalized and sixth order Butterworth filter with a cutoff frequency of 10 Hz was used for noise reduction. Data processing was based on
the time noted by the observer during each gait phase (Figure 1A).
2.2 Estimating torque amplitude for each joint
This method employed 12 joint related positions to collect data from subjects.
Joint torques (Eq. (1)) were calculated by providing joint length, force and angle to
compute muscle force that attributed to joint rotation at different gait phases.
T j..n = Fi ∗ R ∗ sin θ
(1)
F i..n = m i..n ∗ a i..n
(2)
Here, ‘F i ...n’ was the force (Eq. (2)) of each joint (i) derived from mass and
acceleration of each joint, where the acceleration and angle were directly retrieved
from the accelerometer sensor, ‘R’ was taken as length of joint measured before the
experiment was done.
Average torque amplitude was computed as A, the average torque amplitude for
each joint (Eq. (3)).
A j = 1
_
T
∑
t=1
T
A j (t)
(3)