

15
Cerebral Spectral Perturbation during Upper Limb Diagonal Movements
DOI: http://dx.doi.org/10.5772/intechopen.88337
a second-order infinite impulse response (IIR) Butterworth filter. The first two
trials from each block were rejected in order to avoid transient activity related to the
start of the continuous movement.
We then performed independent component analysis (ICA) using the Infomax
algorithm implemented in EEGLAB, over the whole set of electrodes along the
whole recording. Through ICA, we deconstructed the signal into 34 independent
components, allowing us to identify and reject ocular and major motion artifacts.
After labeling and rejection of non-brain-derived activity, we projected the components back into the channel domain to obtain clear EEG time course and to perform
further analysis (for ICA methodological information, see [41]). EEG was finally
offline referenced against the mean of all derivations.
2.3.2.1 Time-frequency analysis
Two-second time windows were extracted, locking t0 with the first sound of
each trial.
Time-frequency analysis was conducted for both single electrodes and four
different region of interests (ROIs): frontal (electrodes F3, Fz, F4), fronto-central
(electrodes FC1, FC2), parietal (electrodes P3, Pz, P4), and POz. These ROIs were
selected on the base of a previous experiment [5] in which an increase in alpha
and beta activity was found along the frontoparietal axis after the performance
of diagonal movements. We extracted time-frequency courses for theta (4–7 Hz),
alpha (8–12 Hz), and beta (13–30 Hz) frequency bands.
First, we computed event-related spectral perturbation (ESRP) on the whole
trial period in EEGLAB. In this way, we obtained one matrix for each electrode,
hence a total of 32 matrices. Each 100 by 200 matrix was composed of 100 frequency values (from 1 to 50 Hz with frequency values distributed logarithmically
over the total amount of rows) × 200 time points (from 1 to 2000 ms). A similar
analysis was conducted by Cohen and colleagues [42].
Then, in order to analyze power value change in each frequency band of interest,
we extracted and averaged data for each desired frequency band, comparing vertical and diagonal arm movement-related spectral perturbation over time.
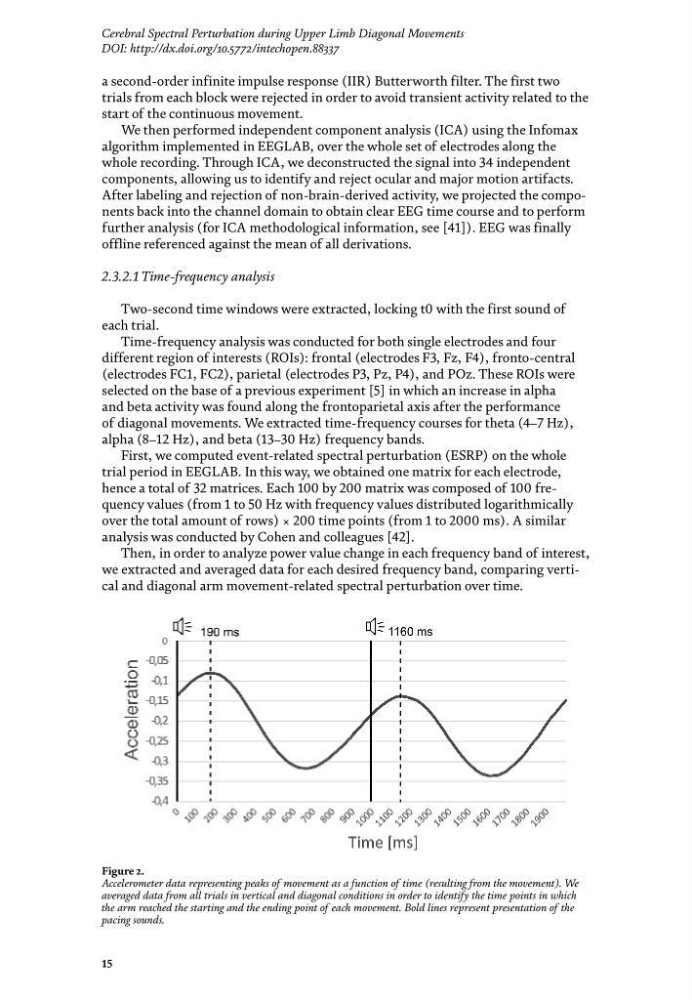
Figure 2.
Accelerometer data representing peaks of movement as a function of time (resulting from the movement). We
averaged data from all trials in vertical and diagonal conditions in order to identify the time points in which
the arm reached the starting and the ending point of each movement. Bold lines represent presentation of the
pacing sounds.
Cerebral Spectral Perturbation during Upper Limb Diagonal Movements
DOI: http://dx.doi.org/10.5772/intechopen.88337
a second-order infinite impulse response (IIR) Butterworth filter. The first two
trials from each block were rejected in order to avoid transient activity related to the
start of the continuous movement.
We then performed independent component analysis (ICA) using the Infomax
algorithm implemented in EEGLAB, over the whole set of electrodes along the
whole recording. Through ICA, we deconstructed the signal into 34 independent
components, allowing us to identify and reject ocular and major motion artifacts.
After labeling and rejection of non-brain-derived activity, we projected the components back into the channel domain to obtain clear EEG time course and to perform
further analysis (for ICA methodological information, see [41]). EEG was finally
offline referenced against the mean of all derivations.
2.3.2.1 Time-frequency analysis
Two-second time windows were extracted, locking t0 with the first sound of
each trial.
Time-frequency analysis was conducted for both single electrodes and four
different region of interests (ROIs): frontal (electrodes F3, Fz, F4), fronto-central
(electrodes FC1, FC2), parietal (electrodes P3, Pz, P4), and POz. These ROIs were
selected on the base of a previous experiment [5] in which an increase in alpha
and beta activity was found along the frontoparietal axis after the performance
of diagonal movements. We extracted time-frequency courses for theta (4–7 Hz),
alpha (8–12 Hz), and beta (13–30 Hz) frequency bands.
First, we computed event-related spectral perturbation (ESRP) on the whole
trial period in EEGLAB. In this way, we obtained one matrix for each electrode,
hence a total of 32 matrices. Each 100 by 200 matrix was composed of 100 frequency values (from 1 to 50 Hz with frequency values distributed logarithmically
over the total amount of rows) × 200 time points (from 1 to 2000 ms). A similar
analysis was conducted by Cohen and colleagues [42].
Then, in order to analyze power value change in each frequency band of interest,
we extracted and averaged data for each desired frequency band, comparing vertical and diagonal arm movement-related spectral perturbation over time.
Figure 2.
Accelerometer data representing peaks of movement as a function of time (resulting from the movement). We
averaged data from all trials in vertical and diagonal conditions in order to identify the time points in which
the arm reached the starting and the ending point of each movement. Bold lines represent presentation of the
pacing sounds.