

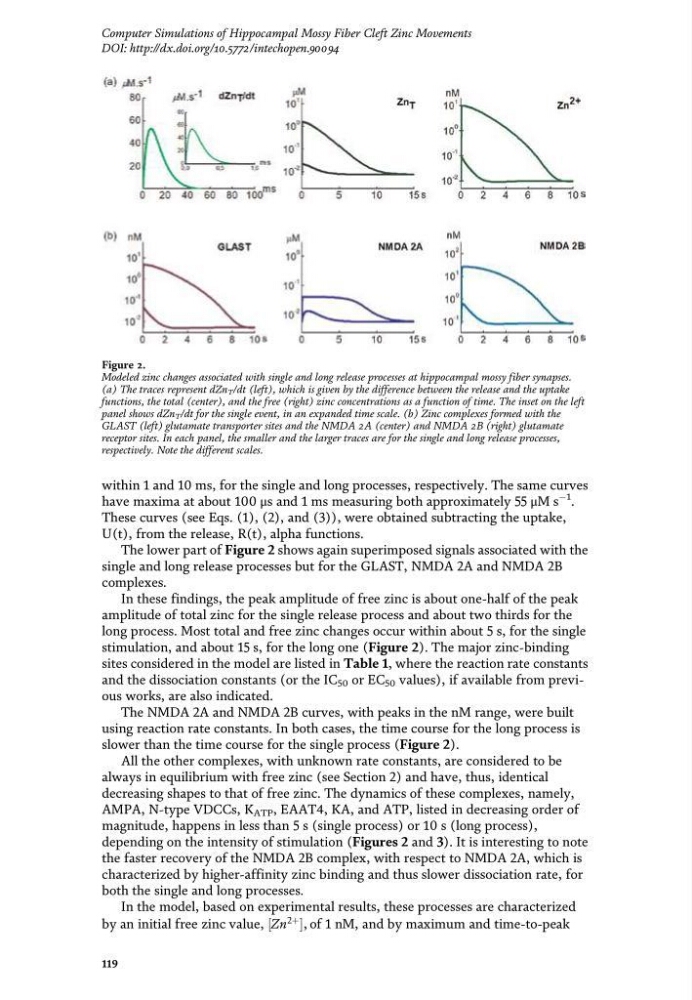
within 1 and 10 ms, for the single and long processes, respectively. The same curves
have maxima at about 100 μs and 1 ms measuring both approximately 55 μMs
�1 .
These curves (see Eqs. (1), (2), and (3)), were obtained subtracting the uptake,
U(t), from the release, R(t), alpha functions.
The lower part of Figure 2 shows again superimposed signals associated with the
single and long release processes but for the GLAST, NMDA 2A and NMDA 2B
complexes.
In these findings, the peak amplitude of free zinc is about one-half of the peak
amplitude of total zinc for the single release process and about two thirds for the
long process. Most total and free zinc changes occur within about 5 s, for the single
stimulation, and about 15 s, for the long one (Figure 2). The major zinc-binding
sites considered in the model are listed in Table 1, where the reaction rate constants
and the dissociation constants (or the IC 50 or EC 50 values), if available from previous works, are also indicated.
The NMDA 2A and NMDA 2B curves, with peaks in the nM range, were built
using reaction rate constants. In both cases, the time course for the long process is
slower than the time course for the single process (Figure 2).
All the other complexes, with unknown rate constants, are considered to be
always in equilibrium with free zinc (see Section 2) and have, thus, identical
decreasing shapes to that of free zinc. The dynamics of these complexes, namely,
AMPA, N-type VDCCs, K ATP , EAAT4, KA, and ATP, listed in decreasing order of
magnitude, happens in less than 5 s (single process) or 10 s (long process),
depending on the intensity of stimulation (Figures 2 and 3). It is interesting to note
the faster recovery of the NMDA 2B complex, with respect to NMDA 2A, which is
characterized by higher-affinity zinc binding and thus slower dissociation rate, for
both the single and long processes.
In the model, based on experimental results, these processes are characterized
by an initial free zinc value, Zn
2þ
½� , of 1 nM, and by maximum and time-to-peak
Figure 2.
Modeled zinc changes associated with single and long release processes at hippocampal mossy fiber synapses.
(a) The traces represent dZn T /dt (left), which is given by the difference between the release and the uptake
functions, the total (center), and the free (right) zinc concentrations as a function of time. The inset on the left
panel shows dZn T /dt for the single event, in an expanded time scale. (b) Zinc complexes formed with the
GLAST (left) glutamate transporter sites and the NMDA 2A (center) and NMDA 2B (right) glutamate
receptor sites. In each panel, the smaller and the larger traces are for the single and long release processes,
respectively. Note the different scales.
119
Computer Simulations of Hippocampal Mossy Fiber Cleft Zinc Movements
DOI: http://dx.doi.org/10.5772/intechopen.90094
have maxima at about 100 μs and 1 ms measuring both approximately 55 μMs
�1 .
These curves (see Eqs. (1), (2), and (3)), were obtained subtracting the uptake,
U(t), from the release, R(t), alpha functions.
The lower part of Figure 2 shows again superimposed signals associated with the
single and long release processes but for the GLAST, NMDA 2A and NMDA 2B
complexes.
In these findings, the peak amplitude of free zinc is about one-half of the peak
amplitude of total zinc for the single release process and about two thirds for the
long process. Most total and free zinc changes occur within about 5 s, for the single
stimulation, and about 15 s, for the long one (Figure 2). The major zinc-binding
sites considered in the model are listed in Table 1, where the reaction rate constants
and the dissociation constants (or the IC 50 or EC 50 values), if available from previous works, are also indicated.
The NMDA 2A and NMDA 2B curves, with peaks in the nM range, were built
using reaction rate constants. In both cases, the time course for the long process is
slower than the time course for the single process (Figure 2).
All the other complexes, with unknown rate constants, are considered to be
always in equilibrium with free zinc (see Section 2) and have, thus, identical
decreasing shapes to that of free zinc. The dynamics of these complexes, namely,
AMPA, N-type VDCCs, K ATP , EAAT4, KA, and ATP, listed in decreasing order of
magnitude, happens in less than 5 s (single process) or 10 s (long process),
depending on the intensity of stimulation (Figures 2 and 3). It is interesting to note
the faster recovery of the NMDA 2B complex, with respect to NMDA 2A, which is
characterized by higher-affinity zinc binding and thus slower dissociation rate, for
both the single and long processes.
In the model, based on experimental results, these processes are characterized
by an initial free zinc value, Zn
2þ
½� , of 1 nM, and by maximum and time-to-peak
Figure 2.
Modeled zinc changes associated with single and long release processes at hippocampal mossy fiber synapses.
(a) The traces represent dZn T /dt (left), which is given by the difference between the release and the uptake
functions, the total (center), and the free (right) zinc concentrations as a function of time. The inset on the left
panel shows dZn T /dt for the single event, in an expanded time scale. (b) Zinc complexes formed with the
GLAST (left) glutamate transporter sites and the NMDA 2A (center) and NMDA 2B (right) glutamate
receptor sites. In each panel, the smaller and the larger traces are for the single and long release processes,
respectively. Note the different scales.
119
Computer Simulations of Hippocampal Mossy Fiber Cleft Zinc Movements
DOI: http://dx.doi.org/10.5772/intechopen.90094