

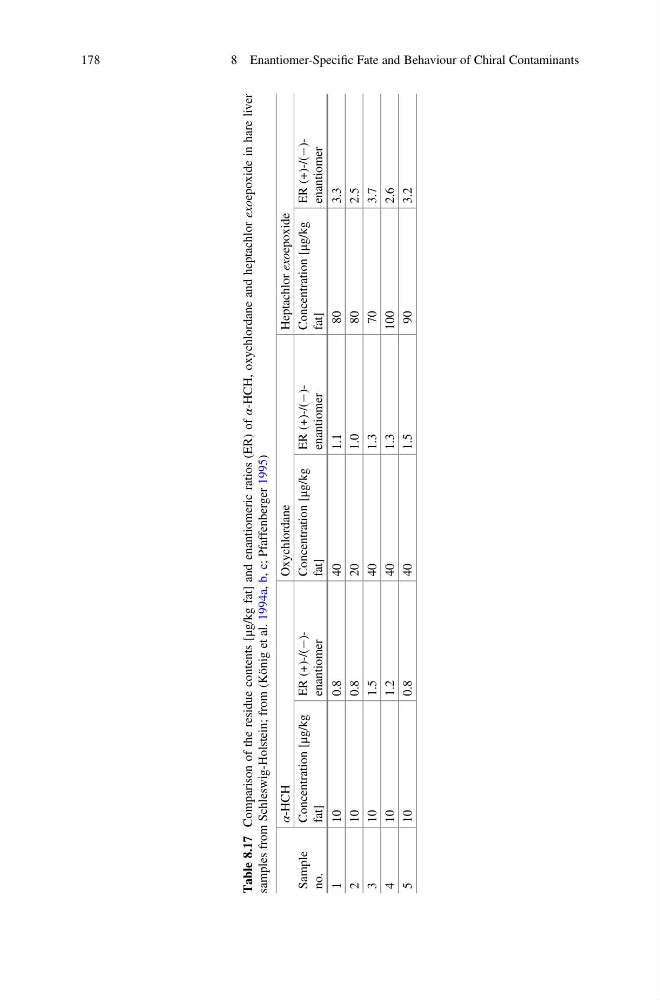
Table 8.17
Comparison of the residue contents [μg/kg fat] and enantiomeric ratios (ER) of
α-HCH, oxychlordane and heptachlor exoepoxide
in hare liver
samples from Schleswig-Holstein; from (König et al. 1994a, b, c; Pfaffenberger 1995)
Sample
no.
α-HCH
Oxychlordane
Heptachlor exoepoxide
Concentration [μg/kg
fat]
ER (+)-/(À)enantiomer
Concentration [μg/kg
fat]
ER (+)-/(À)enantiomer
Concentration [μg/kg
fat]
ER (+)-/(À)enantiomer
1
10
0.8
40
1.1
80
3.3
2
10
0.8
20
1.0
80
2.5
3
10
1.5
40
1.3
70
3.7
4
10
1.2
40
1.3
100
2.6
5
10
0.8
40
1.5
90
3.2
178
8 Enantiomer-Specific Fate and Behaviour of Chiral Contaminants
Comparison of the residue contents [μg/kg fat] and enantiomeric ratios (ER) of
α-HCH, oxychlordane and heptachlor exoepoxide
in hare liver
samples from Schleswig-Holstein; from (König et al. 1994a, b, c; Pfaffenberger 1995)
Sample
no.
α-HCH
Oxychlordane
Heptachlor exoepoxide
Concentration [μg/kg
fat]
ER (+)-/(À)enantiomer
Concentration [μg/kg
fat]
ER (+)-/(À)enantiomer
Concentration [μg/kg
fat]
ER (+)-/(À)enantiomer
1
10
0.8
40
1.1
80
3.3
2
10
0.8
20
1.0
80
2.5
3
10
1.5
40
1.3
70
3.7
4
10
1.2
40
1.3
100
2.6
5
10
0.8
40
1.5
90
3.2
178
8 Enantiomer-Specific Fate and Behaviour of Chiral Contaminants