

samples, are shown in Fig. 8.6. For α-HCH, the average ER value calculated from
the water samples, which were taken at the stations depicted in Fig. 8.7, turned out to
be ER ¼ 0.85 Æ 0.03 for the Baltic Sea and ER ¼ 0.87 Æ 0.05 for the North Sea
(Table 8.4). Furthermore, a verification of the conclusions drawn from the North Sea
results was accomplished by comparison with systematic laboratory measurements
conducted in parallel.
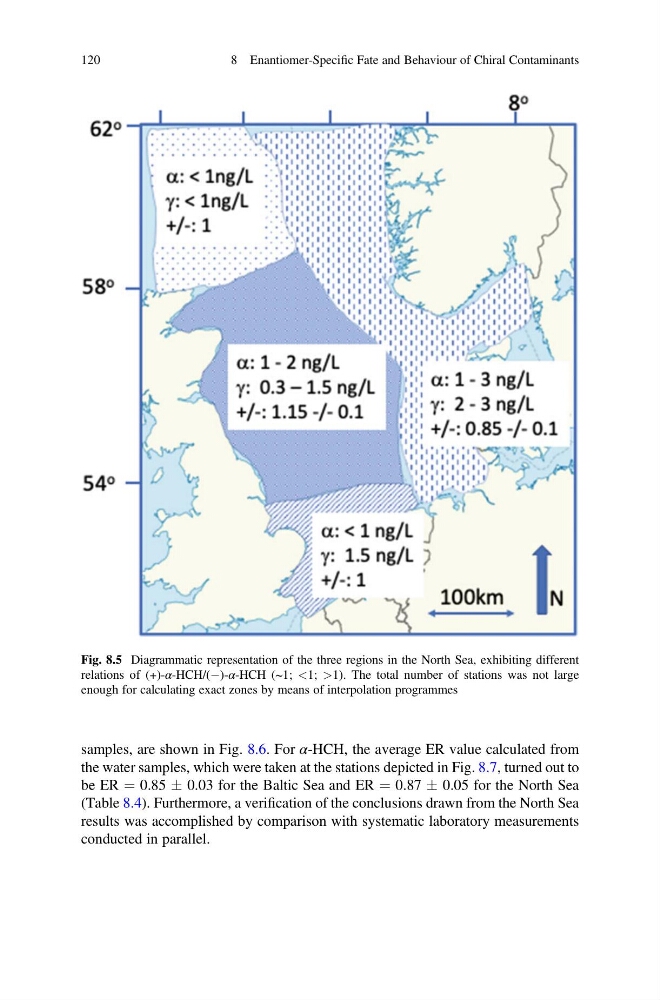
Fig. 8.5 Diagrammatic representation of the three regions in the North Sea, exhibiting different
relations of (+)-α-HCH/(À)-α-HCH (~1; <1; >1). The total number of stations was not large
enough for calculating exact zones by means of interpolation programmes
120
8 Enantiomer-Specific Fate and Behaviour of Chiral Contaminants
the water samples, which were taken at the stations depicted in Fig. 8.7, turned out to
be ER ¼ 0.85 Æ 0.03 for the Baltic Sea and ER ¼ 0.87 Æ 0.05 for the North Sea
(Table 8.4). Furthermore, a verification of the conclusions drawn from the North Sea
results was accomplished by comparison with systematic laboratory measurements
conducted in parallel.
Fig. 8.5 Diagrammatic representation of the three regions in the North Sea, exhibiting different
relations of (+)-α-HCH/(À)-α-HCH (~1; <1; >1). The total number of stations was not large
enough for calculating exact zones by means of interpolation programmes
120
8 Enantiomer-Specific Fate and Behaviour of Chiral Contaminants