

By the beginning of 2018, 79% of the Great Lakes shoreline
had been mapped for soils. Michigan is the lead state for
56% of the soil series identified in the GLCZ, followed by
New York (15%), Wisconsin (10%), Ohio (8%), and Minnesota (4%) (Fig. 1.8). Michigan also has the greatest
proportion of the US Great Lakes coastline at 63%, followed
by Wisconsin (15%), New York (9%), Ohio (8%), and
Minnesota (4%).
Previous summaries of soils of the Great Lakes focused
on sand dunes (Albert 2000) and wetlands (Albert 2003). In
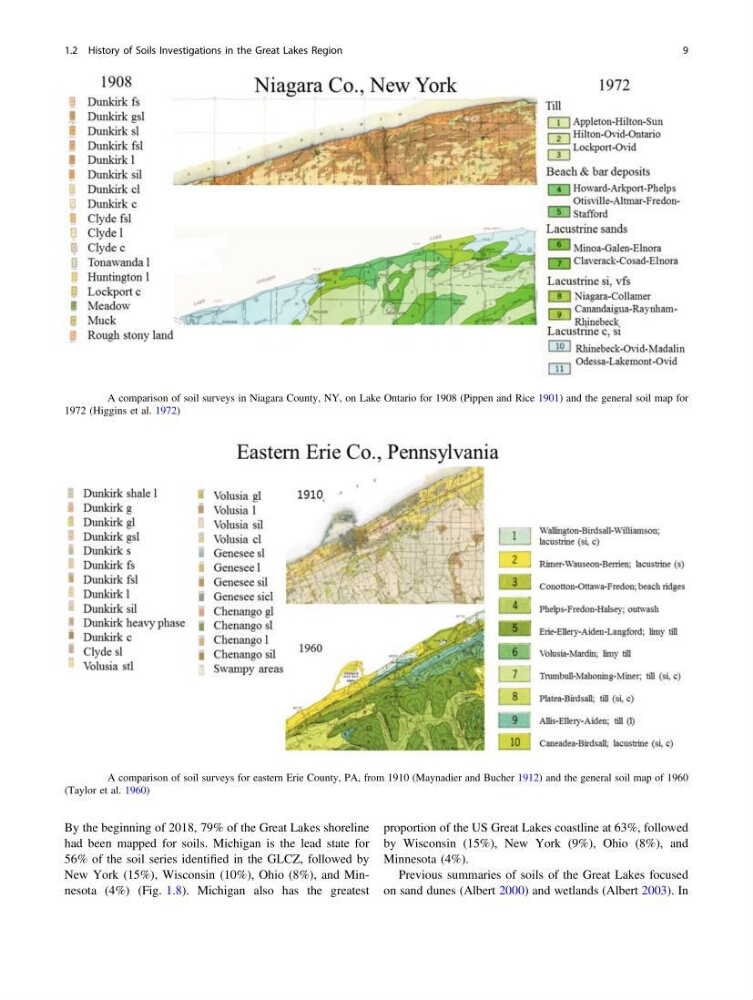
Fig. 1.4 A comparison of soil surveys in Niagara County, NY, on Lake Ontario for 1908 (Pippen and Rice 1901) and the general soil map for
1972 (Higgins et al. 1972)
Fig. 1.5 A comparison of soil surveys for eastern Erie County, PA, from 1910 (Maynadier and Bucher 1912) and the general soil map of 1960
(Taylor et al. 1960)
1.2 History of Soils Investigations in the Great Lakes Region
9
had been mapped for soils. Michigan is the lead state for
56% of the soil series identified in the GLCZ, followed by
New York (15%), Wisconsin (10%), Ohio (8%), and Minnesota (4%) (Fig. 1.8). Michigan also has the greatest
proportion of the US Great Lakes coastline at 63%, followed
by Wisconsin (15%), New York (9%), Ohio (8%), and
Minnesota (4%).
Previous summaries of soils of the Great Lakes focused
on sand dunes (Albert 2000) and wetlands (Albert 2003). In
Fig. 1.4 A comparison of soil surveys in Niagara County, NY, on Lake Ontario for 1908 (Pippen and Rice 1901) and the general soil map for
1972 (Higgins et al. 1972)
Fig. 1.5 A comparison of soil surveys for eastern Erie County, PA, from 1910 (Maynadier and Bucher 1912) and the general soil map of 1960
(Taylor et al. 1960)
1.2 History of Soils Investigations in the Great Lakes Region
9