

28
H. Schlör et al.
Table 16 Development of the trade relations—share of single country on 4-country trade. 1 = 100
Country (growth
rate)/year
1
2
3
4
5
6
7
8
9
10
11
12
A (−0.0%)
100 100 100
99 106 100
99
99
99
99
99
99
B (1.2%)
100 101 102 104 103 106 107 109 110 111 113 114
C (1.9%)
100 102 104 106 110 110 112 114 116 118 121 123
D (−1.3%)
100
99
97
96
91
93
92
91
90
89
88
86
Sum of total
trade
100 100 101 101 103 102 103 103 104 104 105 106
Source Own calculations (2020) and IEK-STE/SRH (2020)
Table 17 Development of production- and consumption-based emissions of the four countries
Country (growth
rate)/year
1
2
3
4
5
6
7
8
9
10
11
12
A (−0.0%)
106 105 105 105 105 105 105 105 105 105 105 105
B (1.2%)
194 196 198 201 204 205 208 210 213 215 218 221
C (1.9%)
176 179 183 186 191 193 197 206 204 208 212 216
D (−1.3%)
123 122 120 119 116 115 114 112 111 110 108 107
Sum of emissions 599 603 607 611 617 619 624 634 633 638 643 648
Source Own calculations (2020) and IEK-STE/SRH (2020)
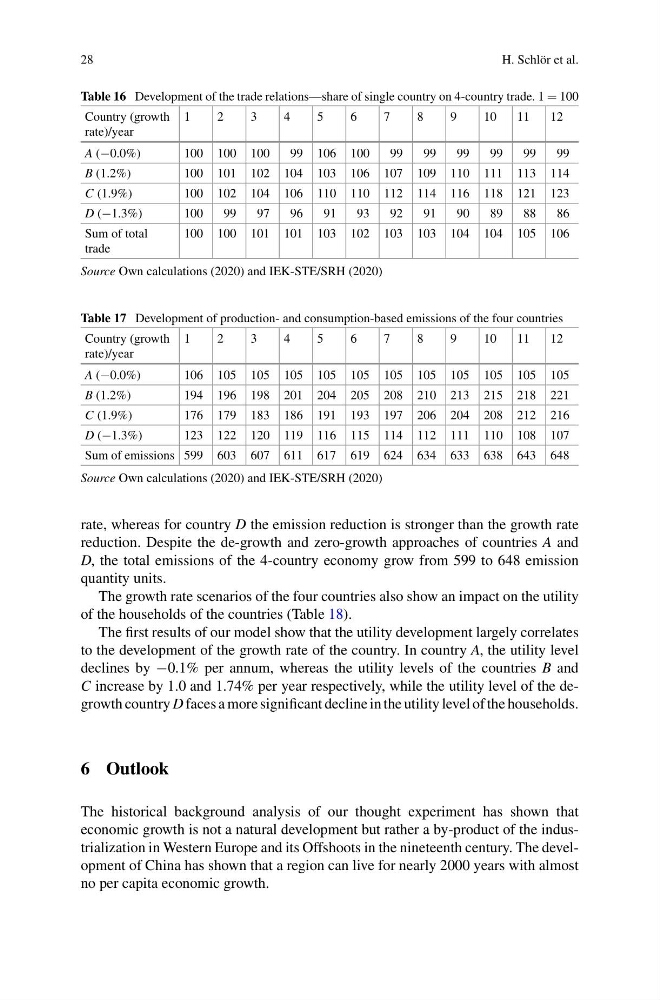
rate, whereas for country D the emission reduction is stronger than the growth rate
reduction. Despite the de-growth and zero-growth approaches of countries A and
D, the total emissions of the 4-country economy grow from 599 to 648 emission
quantity units.
The growth rate scenarios of the four countries also show an impact on the utility
of the households of the countries (Table 18).
The first results of our model show that the utility development largely correlates
to the development of the growth rate of the country. In country A, the utility level
declines by −0.1% per annum, whereas the utility levels of the countries B and
C increase by 1.0 and 1.74% per year respectively, while the utility level of the degrowth country D faces a more significant decline in the utility level of the households.
6 Outlook
The historical background analysis of our thought experiment has shown that
economic growth is not a natural development but rather a by-product of the industrialization in Western Europe and its Offshoots in the nineteenth century. The development of China has shown that a region can live for nearly 2000 years with almost
no per capita economic growth.
H. Schlör et al.
Table 16 Development of the trade relations—share of single country on 4-country trade. 1 = 100
Country (growth
rate)/year
1
2
3
4
5
6
7
8
9
10
11
12
A (−0.0%)
100 100 100
99 106 100
99
99
99
99
99
99
B (1.2%)
100 101 102 104 103 106 107 109 110 111 113 114
C (1.9%)
100 102 104 106 110 110 112 114 116 118 121 123
D (−1.3%)
100
99
97
96
91
93
92
91
90
89
88
86
Sum of total
trade
100 100 101 101 103 102 103 103 104 104 105 106
Source Own calculations (2020) and IEK-STE/SRH (2020)
Table 17 Development of production- and consumption-based emissions of the four countries
Country (growth
rate)/year
1
2
3
4
5
6
7
8
9
10
11
12
A (−0.0%)
106 105 105 105 105 105 105 105 105 105 105 105
B (1.2%)
194 196 198 201 204 205 208 210 213 215 218 221
C (1.9%)
176 179 183 186 191 193 197 206 204 208 212 216
D (−1.3%)
123 122 120 119 116 115 114 112 111 110 108 107
Sum of emissions 599 603 607 611 617 619 624 634 633 638 643 648
Source Own calculations (2020) and IEK-STE/SRH (2020)
rate, whereas for country D the emission reduction is stronger than the growth rate
reduction. Despite the de-growth and zero-growth approaches of countries A and
D, the total emissions of the 4-country economy grow from 599 to 648 emission
quantity units.
The growth rate scenarios of the four countries also show an impact on the utility
of the households of the countries (Table 18).
The first results of our model show that the utility development largely correlates
to the development of the growth rate of the country. In country A, the utility level
declines by −0.1% per annum, whereas the utility levels of the countries B and
C increase by 1.0 and 1.74% per year respectively, while the utility level of the degrowth country D faces a more significant decline in the utility level of the households.
6 Outlook
The historical background analysis of our thought experiment has shown that
economic growth is not a natural development but rather a by-product of the industrialization in Western Europe and its Offshoots in the nineteenth century. The development of China has shown that a region can live for nearly 2000 years with almost
no per capita economic growth.