

Reflections About the Food–Energy–Water Nexus in a World …
27
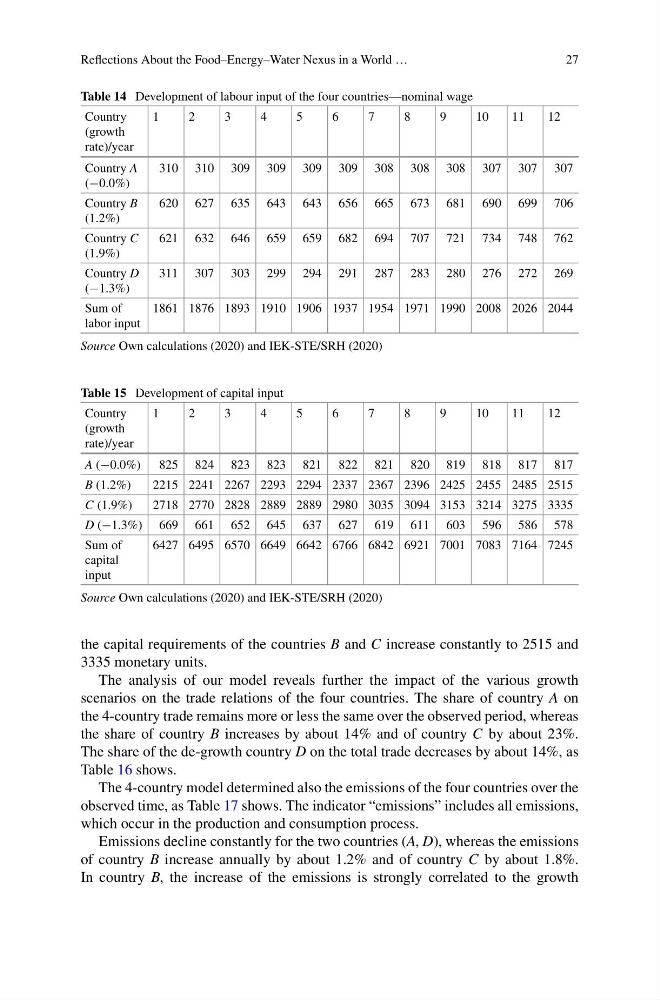
Table 14 Development of labour input of the four countries—nominal wage
Country
(growth
rate)/year
1
2
3
4
5
6
7
8
9
10
11
12
Country A
(−0.0%)
310 310 309 309 309 309 308 308 308 307 307 307
Country B
(1.2%)
620 627 635 643 643 656 665 673 681 690 699 706
Country C
(1.9%)
621 632 646 659 659 682 694 707 721 734 748 762
Country D
(−1.3%)
311 307 303 299 294 291 287 283 280 276 272 269
Sum of
labor input
1861 1876 1893 1910 1906 1937 1954 1971 1990 2008 2026 2044
Source Own calculations (2020) and IEK-STE/SRH (2020)
Table 15 Development of capital input
Country
(growth
rate)/year
1
2
3
4
5
6
7
8
9
10
11
12
A (−0.0%) 825 824 823 823 821 822 821 820 819 818 817 817
B (1.2%)
2215 2241 2267 2293 2294 2337 2367 2396 2425 2455 2485 2515
C (1.9%)
2718 2770 2828 2889 2889 2980 3035 3094 3153 3214 3275 3335
D (−1.3%) 669 661 652 645 637 627 619 611 603 596 586 578
Sum of
capital
input
6427 6495 6570 6649 6642 6766 6842 6921 7001 7083 7164 7245
Source Own calculations (2020) and IEK-STE/SRH (2020)
the capital requirements of the countries B and C increase constantly to 2515 and
3335 monetary units.
The analysis of our model reveals further the impact of the various growth
scenarios on the trade relations of the four countries. The share of country A on
the 4-country trade remains more or less the same over the observed period, whereas
the share of country B increases by about 14% and of country C by about 23%.
The share of the de-growth country D on the total trade decreases by about 14%, as
Table 16 shows.
The 4-country model determined also the emissions of the four countries over the
observed time, as Table 17 shows. The indicator “emissions” includes all emissions,
which occur in the production and consumption process.
Emissions decline constantly for the two countries (A, D), whereas the emissions
of country B increase annually by about 1.2% and of country C by about 1.8%.
In country B, the increase of the emissions is strongly correlated to the growth
27
Table 14 Development of labour input of the four countries—nominal wage
Country
(growth
rate)/year
1
2
3
4
5
6
7
8
9
10
11
12
Country A
(−0.0%)
310 310 309 309 309 309 308 308 308 307 307 307
Country B
(1.2%)
620 627 635 643 643 656 665 673 681 690 699 706
Country C
(1.9%)
621 632 646 659 659 682 694 707 721 734 748 762
Country D
(−1.3%)
311 307 303 299 294 291 287 283 280 276 272 269
Sum of
labor input
1861 1876 1893 1910 1906 1937 1954 1971 1990 2008 2026 2044
Source Own calculations (2020) and IEK-STE/SRH (2020)
Table 15 Development of capital input
Country
(growth
rate)/year
1
2
3
4
5
6
7
8
9
10
11
12
A (−0.0%) 825 824 823 823 821 822 821 820 819 818 817 817
B (1.2%)
2215 2241 2267 2293 2294 2337 2367 2396 2425 2455 2485 2515
C (1.9%)
2718 2770 2828 2889 2889 2980 3035 3094 3153 3214 3275 3335
D (−1.3%) 669 661 652 645 637 627 619 611 603 596 586 578
Sum of
capital
input
6427 6495 6570 6649 6642 6766 6842 6921 7001 7083 7164 7245
Source Own calculations (2020) and IEK-STE/SRH (2020)
the capital requirements of the countries B and C increase constantly to 2515 and
3335 monetary units.
The analysis of our model reveals further the impact of the various growth
scenarios on the trade relations of the four countries. The share of country A on
the 4-country trade remains more or less the same over the observed period, whereas
the share of country B increases by about 14% and of country C by about 23%.
The share of the de-growth country D on the total trade decreases by about 14%, as
Table 16 shows.
The 4-country model determined also the emissions of the four countries over the
observed time, as Table 17 shows. The indicator “emissions” includes all emissions,
which occur in the production and consumption process.
Emissions decline constantly for the two countries (A, D), whereas the emissions
of country B increase annually by about 1.2% and of country C by about 1.8%.
In country B, the increase of the emissions is strongly correlated to the growth