

Reflections About the Food–Energy–Water Nexus in a World …
23
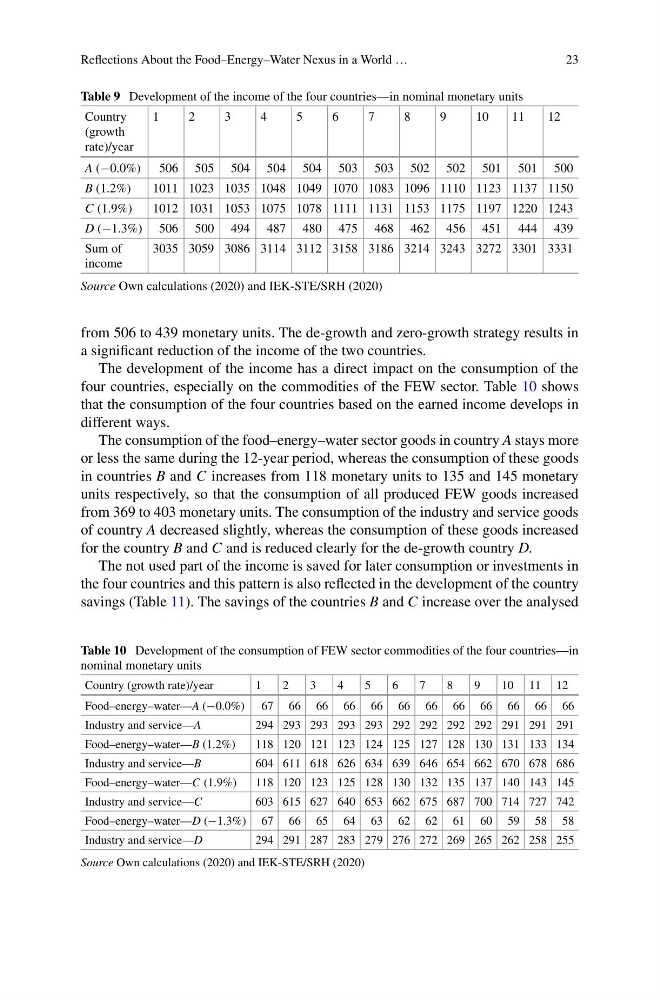
Table 9 Development of the income of the four countries—in nominal monetary units
Country
(growth
rate)/year
1
2
3
4
5
6
7
8
9
10
11
12
A (−0.0%) 506 505 504 504 504 503 503 502 502 501 501 500
B (1.2%)
1011 1023 1035 1048 1049 1070 1083 1096 1110 1123 1137 1150
C (1.9%)
1012 1031 1053 1075 1078 1111 1131 1153 1175 1197 1220 1243
D (−1.3%) 506 500 494 487 480 475 468 462 456 451 444 439
Sum of
income
3035 3059 3086 3114 3112 3158 3186 3214 3243 3272 3301 3331
Source Own calculations (2020) and IEK-STE/SRH (2020)
from 506 to 439 monetary units. The de-growth and zero-growth strategy results in
a significant reduction of the income of the two countries.
The development of the income has a direct impact on the consumption of the
four countries, especially on the commodities of the FEW sector. Table 10 shows
that the consumption of the four countries based on the earned income develops in
different ways.
The consumption of the food–energy–water sector goods in country A stays more
or less the same during the 12-year period, whereas the consumption of these goods
in countries B and C increases from 118 monetary units to 135 and 145 monetary
units respectively, so that the consumption of all produced FEW goods increased
from 369 to 403 monetary units. The consumption of the industry and service goods
of country A decreased slightly, whereas the consumption of these goods increased
for the country B and C and is reduced clearly for the de-growth country D.
The not used part of the income is saved for later consumption or investments in
the four countries and this pattern is also reflected in the development of the country
savings (Table 11). The savings of the countries B and C increase over the analysed
Table 10 Development of the consumption of FEW sector commodities of the four countries—in
nominal monetary units
Country (growth rate)/year
1
2
3
4
5
6
7
8
9
10 11 12
Food–energy–water—A (−0.0%) 67 66 66 66 66 66 66 66 66 66 66 66
Industry and service—A
294 293 293 293 293 292 292 292 292 291 291 291
Food–energy–water—B (1.2%)
118 120 121 123 124 125 127 128 130 131 133 134
Industry and service—B
604 611 618 626 634 639 646 654 662 670 678 686
Food–energy–water—C (1.9%)
118 120 123 125 128 130 132 135 137 140 143 145
Industry and service—C
603 615 627 640 653 662 675 687 700 714 727 742
Food–energy–water—D (−1.3%) 67 66 65 64 63 62 62 61 60 59 58 58
Industry and service—D
294 291 287 283 279 276 272 269 265 262 258 255
Source Own calculations (2020) and IEK-STE/SRH (2020)
23
Table 9 Development of the income of the four countries—in nominal monetary units
Country
(growth
rate)/year
1
2
3
4
5
6
7
8
9
10
11
12
A (−0.0%) 506 505 504 504 504 503 503 502 502 501 501 500
B (1.2%)
1011 1023 1035 1048 1049 1070 1083 1096 1110 1123 1137 1150
C (1.9%)
1012 1031 1053 1075 1078 1111 1131 1153 1175 1197 1220 1243
D (−1.3%) 506 500 494 487 480 475 468 462 456 451 444 439
Sum of
income
3035 3059 3086 3114 3112 3158 3186 3214 3243 3272 3301 3331
Source Own calculations (2020) and IEK-STE/SRH (2020)
from 506 to 439 monetary units. The de-growth and zero-growth strategy results in
a significant reduction of the income of the two countries.
The development of the income has a direct impact on the consumption of the
four countries, especially on the commodities of the FEW sector. Table 10 shows
that the consumption of the four countries based on the earned income develops in
different ways.
The consumption of the food–energy–water sector goods in country A stays more
or less the same during the 12-year period, whereas the consumption of these goods
in countries B and C increases from 118 monetary units to 135 and 145 monetary
units respectively, so that the consumption of all produced FEW goods increased
from 369 to 403 monetary units. The consumption of the industry and service goods
of country A decreased slightly, whereas the consumption of these goods increased
for the country B and C and is reduced clearly for the de-growth country D.
The not used part of the income is saved for later consumption or investments in
the four countries and this pattern is also reflected in the development of the country
savings (Table 11). The savings of the countries B and C increase over the analysed
Table 10 Development of the consumption of FEW sector commodities of the four countries—in
nominal monetary units
Country (growth rate)/year
1
2
3
4
5
6
7
8
9
10 11 12
Food–energy–water—A (−0.0%) 67 66 66 66 66 66 66 66 66 66 66 66
Industry and service—A
294 293 293 293 293 292 292 292 292 291 291 291
Food–energy–water—B (1.2%)
118 120 121 123 124 125 127 128 130 131 133 134
Industry and service—B
604 611 618 626 634 639 646 654 662 670 678 686
Food–energy–water—C (1.9%)
118 120 123 125 128 130 132 135 137 140 143 145
Industry and service—C
603 615 627 640 653 662 675 687 700 714 727 742
Food–energy–water—D (−1.3%) 67 66 65 64 63 62 62 61 60 59 58 58
Industry and service—D
294 291 287 283 279 276 272 269 265 262 258 255
Source Own calculations (2020) and IEK-STE/SRH (2020)