

The German Capability Index—An Operationalization of Sen’s …
169
through the commodities they consume [23]: “Everything we use, wear, buy, sell
and eat takes water to make [83]”.
Hence, the water footprint measures the water consumption along the value chain
of the production of industrial and agricultural goods as well as of the consumption of
the various commodities. The water footprint is an indicator for the use of the resource
water. The indicator makes the hidden water trade at the expense of water-poor
countries more transparent [23].
For Germany, it is the German Environmental Agency (UBA) that calculates the
water footprint. Germany’s total water footprint is 117 billion cubic metres (cbm) of
water per year [23], which corresponds to a daily consumption of nearly 4000 L per
inhabitant. Furthermore, more than half of the water for the products and goods we
consume does not originate from Germany. It represents instead the external water
footprint of Germany through imported goods. The UBA detected that most of the
water used in Germany is attributed to agricultural goods from Brazil, the Ivory Coast
and France [23].
In the following chapter, it will thus be analysed how much the various social
groups according to their social status and income contribute to the German water
footprint.
3.4.1 The Water Footprint of the German Households
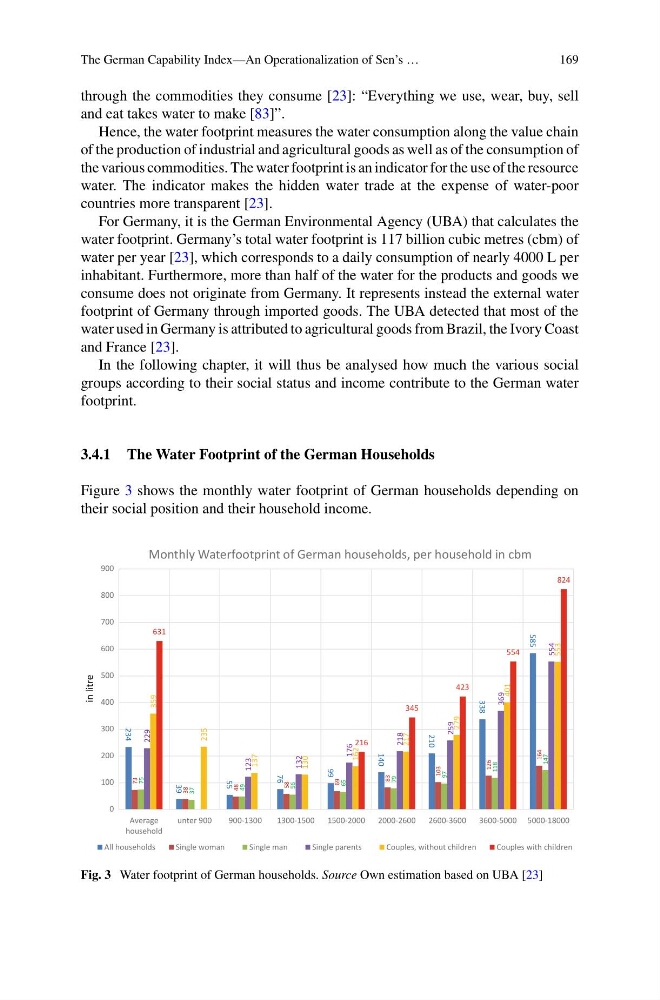
Figure 3 shows the monthly water footprint of German households depending on
their social position and their household income.
234
39
55
76
99
140
210
338
585
73
38
48
58
69
83
103
126
164
75
37
49
56
65
79
97
118
147
229
123
132
176
218
259
369
554
359
235
137
130
162
217
279
401
553
631
216
345
423
554
824
0
100
200
300
400
500
600
700
800
900
Average
household
unter 900
900-1300
1300-1500 1500-2000 2000-2600 2600-3600 3600-5000 5000-18000
Monthly Waterfootprint of German households, per household in cbm
All households
Single woman
Single man
Single parents
Couples, without children
Couples with children
in litre
Fig. 3 Water footprint of German households. Source Own estimation based on UBA [23]
169
through the commodities they consume [23]: “Everything we use, wear, buy, sell
and eat takes water to make [83]”.
Hence, the water footprint measures the water consumption along the value chain
of the production of industrial and agricultural goods as well as of the consumption of
the various commodities. The water footprint is an indicator for the use of the resource
water. The indicator makes the hidden water trade at the expense of water-poor
countries more transparent [23].
For Germany, it is the German Environmental Agency (UBA) that calculates the
water footprint. Germany’s total water footprint is 117 billion cubic metres (cbm) of
water per year [23], which corresponds to a daily consumption of nearly 4000 L per
inhabitant. Furthermore, more than half of the water for the products and goods we
consume does not originate from Germany. It represents instead the external water
footprint of Germany through imported goods. The UBA detected that most of the
water used in Germany is attributed to agricultural goods from Brazil, the Ivory Coast
and France [23].
In the following chapter, it will thus be analysed how much the various social
groups according to their social status and income contribute to the German water
footprint.
3.4.1 The Water Footprint of the German Households
Figure 3 shows the monthly water footprint of German households depending on
their social position and their household income.
234
39
55
76
99
140
210
338
585
73
38
48
58
69
83
103
126
164
75
37
49
56
65
79
97
118
147
229
123
132
176
218
259
369
554
359
235
137
130
162
217
279
401
553
631
216
345
423
554
824
0
100
200
300
400
500
600
700
800
900
Average
household
unter 900
900-1300
1300-1500 1500-2000 2000-2600 2600-3600 3600-5000 5000-18000
Monthly Waterfootprint of German households, per household in cbm
All households
Single woman
Single man
Single parents
Couples, without children
Couples with children
in litre
Fig. 3 Water footprint of German households. Source Own estimation based on UBA [23]